Citibank 2013 Annual Report Download - page 279
Download and view the complete annual report
Please find page 279 of the 2013 Citibank annual report below. You can navigate through the pages in the report by either clicking on the pages listed below, or by using the keyword search tool below to find specific information within the annual report.-
 1
1 -
2
-
3
-
4
-
5
-
6
-
7
-
8
-
9
-
10
-
11
-
12
-
13
-
14
-
15
-
16
-
17
-
18
-
19
-
20
-
21
-
22
-
23
-
24
-
25
-
26
-
27
-
28
-
29
-
30
-
31
-
32
-
33
-
34
-
35
-
36
-
37
-
38
-
39
-
40
-
41
-
42
-
43
-
44
-
45
-
46
-
47
-
48
-
49
-
50
-
51
-
52
-
53
-
54
-
55
-
56
-
57
-
58
-
59
-
60
-
61
-
62
-
63
-
64
-
65
-
66
-
67
-
68
-
69
-
70
-
71
-
72
-
73
-
74
-
75
-
76
-
77
-
78
-
79
-
80
-
81
-
82
-
83
-
84
-
85
-
86
-
87
-
88
-
89
-
90
-
91
-
92
-
93
-
94
-
95
-
96
-
97
-
98
-
99
-
100
-
101
-
102
-
103
-
104
-
105
-
106
-
107
-
108
-
109
-
110
-
111
-
112
-
113
-
114
-
115
-
116
-
117
-
118
-
119
-
120
-
121
-
122
-
123
-
124
-
125
-
126
-
127
-
128
-
129
-
130
-
131
-
132
-
133
-
134
-
135
-
136
-
137
-
138
-
139
-
140
-
141
-
142
-
143
-
144
-
145
-
146
-
147
-
148
-
149
-
150
-
151
-
152
-
153
-
154
-
155
-
156
-
157
-
158
-
159
-
160
-
161
-
162
-
163
-
164
-
165
-
166
-
167
-
168
-
169
-
170
-
171
-
172
-
173
-
174
-
175
-
176
-
177
-
178
-
179
-
180
-
181
-
182
-
183
-
184
-
185
-
186
-
187
-
188
-
189
-
190
-
191
-
192
-
193
-
194
-
195
-
196
-
197
-
198
-
199
-
200
-
201
-
202
-
203
-
204
-
205
-
206
-
207
-
208
-
209
-
210
-
211
-
212
-
213
-
214
-
215
-
216
-
217
-
218
-
219
-
220
-
221
-
222
-
223
-
224
-
225
-
226
-
227
-
228
-
229
-
230
-
231
-
232
-
233
-
234
-
235
-
236
-
237
-
238
-
239
-
240
-
241
-
242
-
243
-
244
-
245
-
246
-
247
-
248
-
249
-
250
-
251
-
252
-
253
-
254
-
255
-
256
-
257
-
258
-
259
-
260
-
261
-
262
-
263
-
264
-
265
-
266
-
267
-
268
-
 269
269 -
 270
270 -
 271
271 -
 272
272 -
 273
273 -
 274
274 -
 275
275 -
 276
276 -
 277
277 -
 278
278 -
 279
279 -
 280
280 -
 281
281 -
 282
282 -
 283
283 -
 284
284 -
 285
285 -
 286
286 -
 287
287 -
 288
288 -
 289
289 -
290
-
291
-
292
-
293
-
294
-
295
-
296
-
297
-
298
-
299
-
300
-
301
-
302
-
303
-
304
-
305
-
306
-
307
-
308
-
309
-
310
-
311
-
312
-
313
-
314
-
315
-
316
-
317
-
318
-
319
-
320
-
321
-
322
-
323
-
324
-
325
-
326
-
327
-
328
-
329
-
330
-
331
-
332
-
333
-
334
-
335
-
336
-
337
-
338
-
339
-
340
-
341
-
342
 |
 |

261
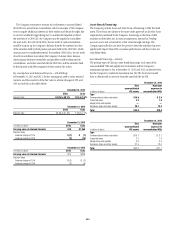
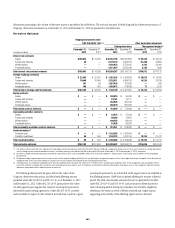
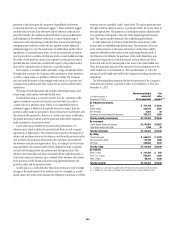
Derivative Mark-to-Market (MTM) Receivables/Payables
In millions of dollars at December 31, 2013
Derivatives classified in Trading
accounts assets / liabilities (1)(2)(3)
Derivatives classified in Other
assets / liabilities (2)(3)
Derivatives instruments designated as ASC 815 (SFAS 133) hedges Assets Liabilities Assets Liabilities
Over-the-counter $ 956 $ 306 $ 3,082 $ 854
Cleared 2,505 585 5 —
Exchange traded — — — —
Interest rate contracts $ 3,461 $ 891 $ 3,087 $ 854
Over-the-counter $ 1,540 $ 1,244 $ 989 $ 293
Cleared — — — —
Exchange traded — — — —
Foreign exchange contracts $ 1,540 $ 1,244 $ 989 $ 293
Over-the-counter $ — $ — $ — $ 2
Cleared — — — —
Exchange traded — — — —
Credit Derivatives $ — $ — $ — $ 2
Total derivative instruments designated as ASC 815 (SFAS 133) hedges $ 5,001 $ 2,135 $ 4,076 $1,149
Derivatives instruments not designated as ASC 815 (SFAS 133) hedges
Over-the-counter $ 314,250 $ 297,589 $ 37 $ 9
Cleared 310,636 318,716 27 5
Exchange traded 33 30 — —
Interest rate contracts $ 624,919 $ 616,335 $ 64 $ 14
Over-the-counter $ 90,965 $ 87,336 $ 79 $ 3
Cleared 1 2 — —
Exchange traded 48 55 — —
Foreign exchange contracts $ 91,014 $ 87,393 $ 79 $ 3
Over-the-counter $ 19,080 $ 28,458 $ — $ —
Cleared — — — —
Exchange traded 5,797 5,834 — —
Equity contracts $ 24,877 $ 34,292 $ — $ —
Over-the-counter $ 7,921 $ 9,059 $ — $ —
Cleared — — — —
Exchange traded 1,161 1,111 — —
Commodity and other contracts $ 9,082 $ 10,170 $ — $ —
Over-the-counter $ 38,496 $ 38,247 $ 71 $ 563
Cleared 1,850 2,547 — —
Exchange traded — — — —
Credit derivatives (4) $ 40,346 $ 40,794 $ 71 $ 563
Total derivatives instruments not designated as ASC 815 (SFAS 133) hedges $ 790,238 $ 788,984 $ 214 $ 580
Total derivatives $ 795,239 $ 791,119 $ 4,290 $ 1,729
Cash collateral paid/received (5)(6) $ 6,073 $ 8,827 $ 82 $ 282
Less: Netting agreements (7) (713,598) (713,598) — —
Less: Netting cash collateral received/paid (8) (34,893) (39,094) (2,951) —
Net receivables/payables included on the Consolidated Balance Sheet (9) $ 52,821 $ 47,254 $ 1,421 $ 2,011
Additional amounts subject to an enforceable master netting agreement
but not offset on the Consolidated Balance Sheet
Less: Does not meet applicable offsetting guidance $ — $ — $ — $ —
Less: Cash collateral received/paid (365) (5) — —
Less: Non-cash collateral received/paid (7,478) (3,345) (341) —
Total Net receivables/payables (9) $ 44,978 $ 43,904 $ 1,080 $ 2,011