Citibank 2013 Annual Report Download - page 282
Download and view the complete annual report
Please find page 282 of the 2013 Citibank annual report below. You can navigate through the pages in the report by either clicking on the pages listed below, or by using the keyword search tool below to find specific information within the annual report.-
 1
1 -
2
-
3
-
4
-
5
-
6
-
7
-
8
-
9
-
10
-
11
-
12
-
13
-
14
-
15
-
16
-
17
-
18
-
19
-
20
-
21
-
22
-
23
-
24
-
25
-
26
-
27
-
28
-
29
-
30
-
31
-
32
-
33
-
34
-
35
-
36
-
37
-
38
-
39
-
40
-
41
-
42
-
43
-
44
-
45
-
46
-
47
-
48
-
49
-
50
-
51
-
52
-
53
-
54
-
55
-
56
-
57
-
58
-
59
-
60
-
61
-
62
-
63
-
64
-
65
-
66
-
67
-
68
-
69
-
70
-
71
-
72
-
73
-
74
-
75
-
76
-
77
-
78
-
79
-
80
-
81
-
82
-
83
-
84
-
85
-
86
-
87
-
88
-
89
-
90
-
91
-
92
-
93
-
94
-
95
-
96
-
97
-
98
-
99
-
100
-
101
-
102
-
103
-
104
-
105
-
106
-
107
-
108
-
109
-
110
-
111
-
112
-
113
-
114
-
115
-
116
-
117
-
118
-
119
-
120
-
121
-
122
-
123
-
124
-
125
-
126
-
127
-
128
-
129
-
130
-
131
-
132
-
133
-
134
-
135
-
136
-
137
-
138
-
139
-
140
-
141
-
142
-
143
-
144
-
145
-
146
-
147
-
148
-
149
-
150
-
151
-
152
-
153
-
154
-
155
-
156
-
157
-
158
-
159
-
160
-
161
-
162
-
163
-
164
-
165
-
166
-
167
-
168
-
169
-
170
-
171
-
172
-
173
-
174
-
175
-
176
-
177
-
178
-
179
-
180
-
181
-
182
-
183
-
184
-
185
-
186
-
187
-
188
-
189
-
190
-
191
-
192
-
193
-
194
-
195
-
196
-
197
-
198
-
199
-
200
-
201
-
202
-
203
-
204
-
205
-
206
-
207
-
208
-
209
-
210
-
211
-
212
-
213
-
214
-
215
-
216
-
217
-
218
-
219
-
220
-
221
-
222
-
223
-
224
-
225
-
226
-
227
-
228
-
229
-
230
-
231
-
232
-
233
-
234
-
235
-
236
-
237
-
238
-
239
-
240
-
241
-
242
-
243
-
244
-
245
-
246
-
247
-
248
-
249
-
250
-
251
-
252
-
253
-
254
-
255
-
256
-
257
-
258
-
259
-
260
-
261
-
262
-
263
-
264
-
265
-
266
-
267
-
268
-
269
-
270
-
271
-
 272
272 -
 273
273 -
 274
274 -
 275
275 -
 276
276 -
 277
277 -
 278
278 -
 279
279 -
 280
280 -
 281
281 -
 282
282 -
 283
283 -
 284
284 -
 285
285 -
 286
286 -
 287
287 -
 288
288 -
 289
289 -
 290
290 -
 291
291 -
 292
292 -
293
-
294
-
295
-
296
-
297
-
298
-
299
-
300
-
301
-
302
-
303
-
304
-
305
-
306
-
307
-
308
-
309
-
310
-
311
-
312
-
313
-
314
-
315
-
316
-
317
-
318
-
319
-
320
-
321
-
322
-
323
-
324
-
325
-
326
-
327
-
328
-
329
-
330
-
331
-
332
-
333
-
334
-
335
-
336
-
337
-
338
-
339
-
340
-
341
-
342
 |
 |

264
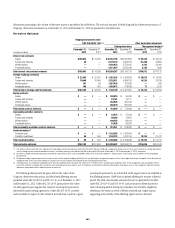
The amounts recognized in Principal transactions in the Consolidated
Statement of Income for the years ended December 31, 2013, 2012 and 2011
related to derivatives not designated in a qualifying hedging relationship as
well as the underlying non-derivative instruments are presented in Note 6
to the Consolidated Financial Statements. Citigroup presents this disclosure
by business classification, showing derivative gains and losses related to its
trading activities together with gains and losses related to non-derivative
instruments within the same trading portfolios, as this represents the way
these portfolios are risk managed.
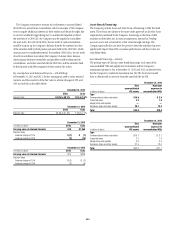
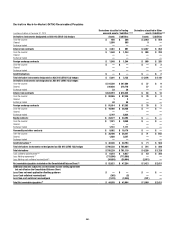
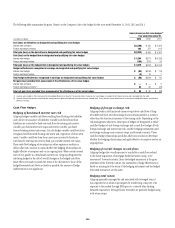
The amounts recognized in Other revenue in the Consolidated Statement
of Income for the years ended December 31, 2013, 2012 and 2011 related to
derivatives not designated in a qualifying hedging relationship are shown
below. The table below does not include the offsetting gains/losses on the
hedged items, which amounts are also recorded in Other revenue.
Gains (losses) included in Other revenue
Year ended December 31,
In millions of dollars 2013 2012 2011
Interest rate contracts $(376) $ (427) $1,192
Foreign exchange 221 182 224
Credit derivatives (595) (1,022) 115
Total Citigroup $(750) $(1,267) $1,531
Accounting for Derivative Hedging
Citigroup accounts for its hedging activities in accordance with ASC 815,
Derivatives and Hedging (formerly SFAS 133). As a general rule, hedge
accounting is permitted where the Company is exposed to a particular risk,
such as interest-rate or foreign-exchange risk, that causes changes in the
fair value of an asset or liability or variability in the expected future cash
flows of an existing asset, liability or a forecasted transaction that may
affect earnings.
Derivative contracts hedging the risks associated with the changes in fair
value are referred to as fair value hedges, while contracts hedging the risks
affecting the expected future cash flows are called cash flow hedges. Hedges
that utilize derivatives or debt instruments to manage the foreign exchange
risk associated with equity investments in non-U.S.-dollar-functional-
currency foreign subsidiaries (net investment in a foreign operation) are
called net investment hedges.
If certain hedging criteria specified in ASC 815 are met, including testing
for hedge effectiveness, special hedge accounting may be applied. The hedge
effectiveness assessment methodologies for similar hedges are performed
in a similar manner and are used consistently throughout the hedging
relationships. For fair value hedges, the changes in value of the hedging
derivative, as well as the changes in value of the related hedged item due to
the risk being hedged, are reflected in current earnings. For cash flow hedges
and net investment hedges, the changes in value of the hedging derivative are
reflected in Accumulated other comprehensive income (loss) in Citigroup’s
stockholders’ equity, to the extent the hedge is effective. Hedge ineffectiveness,
in either case, is reflected in current earnings.
For asset/liability management hedging, the fixed-rate long-term debt
would be recorded at amortized cost under current GAAP. However, by electing
to use ASC 815 (SFAS 133) fair value hedge accounting, the carrying value
of the debt is adjusted for changes in the benchmark interest rate, with any
such changes in value recorded in current earnings. The related interest-rate
swap also is recorded on the balance sheet at fair value, with any changes
in fair value reflected in earnings. Thus, any ineffectiveness resulting from
the hedging relationship is recorded in current earnings. Alternatively, a
management hedge, which does not meet the ASC 815 hedging criteria,
would involve recording only the derivative at fair value on the balance sheet,
with its associated changes in fair value recorded in earnings. The debt would
continue to be carried at amortized cost and, therefore, current earnings
would be impacted only by the interest rate shifts and other factors that cause
the change in the swap’s value and may change the underlying yield of the
debt. This type of hedge is undertaken when hedging requirements cannot
be achieved or management decides not to apply ASC 815 hedge accounting.
Another alternative for the Company is to elect to carry the debt at fair
value under the fair value option. Once the irrevocable election is made
upon issuance of the debt, the full change in fair value of the debt would
be reported in earnings. The related interest rate swap, with changes in fair
value, would also be reflected in earnings, and provides a natural offset to the
debt’s fair value change. To the extent the two offsets are not exactly equal,
the difference is reflected in current earnings.