Citibank 2013 Annual Report Download - page 100
Download and view the complete annual report
Please find page 100 of the 2013 Citibank annual report below. You can navigate through the pages in the report by either clicking on the pages listed below, or by using the keyword search tool below to find specific information within the annual report.-
 1
1 -
2
-
3
-
4
-
5
-
6
-
7
-
8
-
9
-
10
-
11
-
12
-
13
-
14
-
15
-
16
-
17
-
18
-
19
-
20
-
21
-
22
-
23
-
24
-
25
-
26
-
27
-
28
-
29
-
30
-
31
-
32
-
33
-
34
-
35
-
36
-
37
-
38
-
39
-
40
-
41
-
42
-
43
-
44
-
45
-
46
-
47
-
48
-
49
-
50
-
51
-
52
-
53
-
54
-
55
-
56
-
57
-
58
-
59
-
60
-
61
-
62
-
63
-
64
-
65
-
66
-
67
-
68
-
69
-
70
-
71
-
72
-
73
-
74
-
75
-
76
-
77
-
78
-
79
-
80
-
81
-
82
-
83
-
84
-
85
-
86
-
87
-
88
-
89
-
 90
90 -
 91
91 -
 92
92 -
 93
93 -
 94
94 -
 95
95 -
 96
96 -
 97
97 -
 98
98 -
 99
99 -
 100
100 -
 101
101 -
 102
102 -
 103
103 -
 104
104 -
 105
105 -
 106
106 -
 107
107 -
 108
108 -
 109
109 -
 110
110 -
111
-
112
-
113
-
114
-
115
-
116
-
117
-
118
-
119
-
120
-
121
-
122
-
123
-
124
-
125
-
126
-
127
-
128
-
129
-
130
-
131
-
132
-
133
-
134
-
135
-
136
-
137
-
138
-
139
-
140
-
141
-
142
-
143
-
144
-
145
-
146
-
147
-
148
-
149
-
150
-
151
-
152
-
153
-
154
-
155
-
156
-
157
-
158
-
159
-
160
-
161
-
162
-
163
-
164
-
165
-
166
-
167
-
168
-
169
-
170
-
171
-
172
-
173
-
174
-
175
-
176
-
177
-
178
-
179
-
180
-
181
-
182
-
183
-
184
-
185
-
186
-
187
-
188
-
189
-
190
-
191
-
192
-
193
-
194
-
195
-
196
-
197
-
198
-
199
-
200
-
201
-
202
-
203
-
204
-
205
-
206
-
207
-
208
-
209
-
210
-
211
-
212
-
213
-
214
-
215
-
216
-
217
-
218
-
219
-
220
-
221
-
222
-
223
-
224
-
225
-
226
-
227
-
228
-
229
-
230
-
231
-
232
-
233
-
234
-
235
-
236
-
237
-
238
-
239
-
240
-
241
-
242
-
243
-
244
-
245
-
246
-
247
-
248
-
249
-
250
-
251
-
252
-
253
-
254
-
255
-
256
-
257
-
258
-
259
-
260
-
261
-
262
-
263
-
264
-
265
-
266
-
267
-
268
-
269
-
270
-
271
-
272
-
273
-
274
-
275
-
276
-
277
-
278
-
279
-
280
-
281
-
282
-
283
-
284
-
285
-
286
-
287
-
288
-
289
-
290
-
291
-
292
-
293
-
294
-
295
-
296
-
297
-
298
-
299
-
300
-
301
-
302
-
303
-
304
-
305
-
306
-
307
-
308
-
309
-
310
-
311
-
312
-
313
-
314
-
315
-
316
-
317
-
318
-
319
-
320
-
321
-
322
-
323
-
324
-
325
-
326
-
327
-
328
-
329
-
330
-
331
-
332
-
333
-
334
-
335
-
336
-
337
-
338
-
339
-
340
-
341
-
342
 |
 |
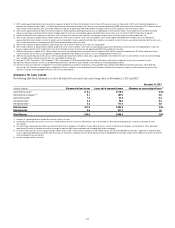
82
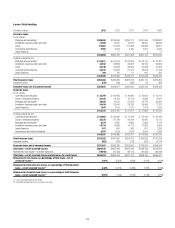
North America Consumer Mortgage Lending
Overview
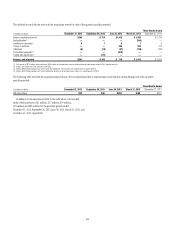
Citi’s North America Consumer mortgage portfolio consists of both
residential first mortgages and home equity loans. At December 31, 2013,
Citi’s North America Consumer residential first mortgage portfolio was
$75.9 billion (compared to $88.2 billion at December 31, 2012), while the
home equity loan portfolio was $31.6 billion (compared to $37.2 billion at
December 31, 2012). At December 31, 2013, $44.6 billion of first mortgages
was recorded in Citi Holdings, with the remaining $31.3 billion recorded
in Citicorp. At December 31, 2013, $28.7 billion of home equity loans
was recorded in Citi Holdings, with the remaining $2.9 billion recorded
in Citicorp.
Citi’s residential first mortgage portfolio included $7.7 billion of loans
with FHA insurance or VA guarantees at December 31, 2013, compared to
$8.5 billion at December 31, 2012. This portfolio consists of loans to low-to-
moderate-income borrowers with lower FICO (Fair Isaac Corporation) scores
and generally has higher loan-to-value ratios (LTVs). Credit losses on FHA
loans are borne by the sponsoring governmental agency, provided that the
insurance terms have not been rescinded as a result of an origination defect.
With respect to VA loans, the VA establishes a loan-level loss cap, beyond
which Citi is liable for loss. While FHA and VA loans have high delinquency
rates, given the insurance and guarantees, respectively, Citi has experienced
negligible credit losses on these loans.
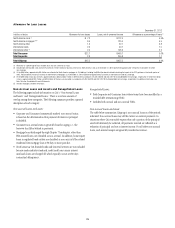
In addition, Citi’s residential first mortgage portfolio included $1.1 billion
of loans with origination LTVs above 80% that have insurance through
mortgage insurance companies at December 31, 2013, compared to
$1.5 billion at December 31, 2012. At December 31, 2013, the residential
first mortgage portfolio also had $0.8 billion of loans subject to long-term
standby commitments (LTSCs) with U.S. government-sponsored entities
(GSEs) for which Citi has limited exposure to credit losses, compared to
$1.0 billion at December 31, 2012. Citi’s home equity loan portfolio also
included $0.3 billion of loans subject to LTSCs with GSEs (compared to
$0.4 billion at December 31, 2012) for which Citi also has limited exposure
to credit losses. These guarantees and commitments may be rescinded in the
event of loan origination defects. Citi’s allowance for loan loss calculations
takes into consideration the impact of the guarantees and commitments
described above.
Citi does not offer option-adjustable rate mortgages/negative-amortizing
mortgage products to its customers. As a result, option-adjustable rate
mortgages/negative-amortizing mortgages represent an insignificant portion
of total balances, since they were acquired only incidentally as part of prior
portfolio and business purchases.
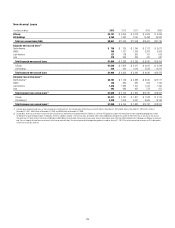
As of December 31, 2013, Citi’s North America residential first mortgage
portfolio contained approximately $5.0 billion of adjustable rate mortgages
that are currently required to make a payment only of accrued interest for
the payment period, or an interest-only payment, compared to $7.7 billion
at December 31, 2012. This decline resulted primarily from repayments of
$1.2 billion, conversions to amortizing loans of $1.0 billion and asset sales of
$0.4 billion. Borrowers who are currently required to make an interest-only
payment cannot select a lower payment that would negatively amortize the
loan. Residential first mortgages with this payment feature are primarily
to high-credit-quality borrowers who have on average significantly higher
origination and refreshed FICO scores than other loans in the residential first
mortgage portfolio, and have exhibited significantly lower 30+ delinquency
rates as compared with residential first mortgages without this payment
feature. As such, Citi does not believe the residential mortgage loans with this
payment feature represent substantially higher risk in the portfolio.
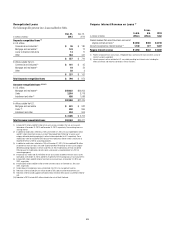
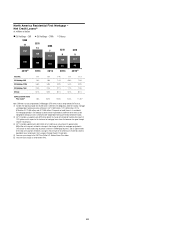
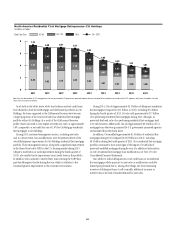
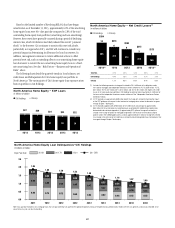
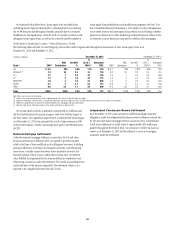
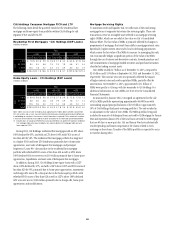
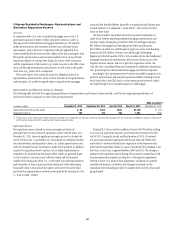
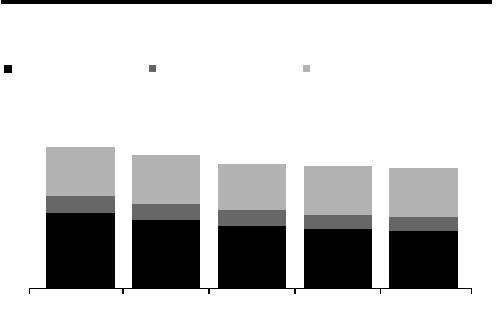
North America Consumer Mortgage Quarterly Credit Trends—Net Credit
Losses and Delinquencies—Residential First Mortgages
The following charts detail the quarterly trends in loan balances, net credit
losses and delinquencies for Citigroup’s residential first mortgage portfolio in
North America. As set forth in the tables below, approximately 59% of Citi’s
residential first mortgage exposure arises from its portfolio in Citi Holdings,
which includes residential first mortgages originated by both CitiMortgage as
well as Citi’s legacy CitiFinancial North America business.
4Q’133Q’132Q’131Q’134Q’12
47
11
31
43
10
31
39
10
29
37
9
31
36
9
31
North America Residential First Mortgage — EOP Loans
In billions of dollars
Citi Holdings - CMI Citi Holdings - CFNA Citicorp
$88 $84 $78 $76
$77