Citibank 2013 Annual Report Download - page 308
Download and view the complete annual report
Please find page 308 of the 2013 Citibank annual report below. You can navigate through the pages in the report by either clicking on the pages listed below, or by using the keyword search tool below to find specific information within the annual report.-
 1
1 -
2
-
3
-
4
-
5
-
6
-
7
-
8
-
9
-
10
-
11
-
12
-
13
-
14
-
15
-
16
-
17
-
18
-
19
-
20
-
21
-
22
-
23
-
24
-
25
-
26
-
27
-
28
-
29
-
30
-
31
-
32
-
33
-
34
-
35
-
36
-
37
-
38
-
39
-
40
-
41
-
42
-
43
-
44
-
45
-
46
-
47
-
48
-
49
-
50
-
51
-
52
-
53
-
54
-
55
-
56
-
57
-
58
-
59
-
60
-
61
-
62
-
63
-
64
-
65
-
66
-
67
-
68
-
69
-
70
-
71
-
72
-
73
-
74
-
75
-
76
-
77
-
78
-
79
-
80
-
81
-
82
-
83
-
84
-
85
-
86
-
87
-
88
-
89
-
90
-
91
-
92
-
93
-
94
-
95
-
96
-
97
-
98
-
99
-
100
-
101
-
102
-
103
-
104
-
105
-
106
-
107
-
108
-
109
-
110
-
111
-
112
-
113
-
114
-
115
-
116
-
117
-
118
-
119
-
120
-
121
-
122
-
123
-
124
-
125
-
126
-
127
-
128
-
129
-
130
-
131
-
132
-
133
-
134
-
135
-
136
-
137
-
138
-
139
-
140
-
141
-
142
-
143
-
144
-
145
-
146
-
147
-
148
-
149
-
150
-
151
-
152
-
153
-
154
-
155
-
156
-
157
-
158
-
159
-
160
-
161
-
162
-
163
-
164
-
165
-
166
-
167
-
168
-
169
-
170
-
171
-
172
-
173
-
174
-
175
-
176
-
177
-
178
-
179
-
180
-
181
-
182
-
183
-
184
-
185
-
186
-
187
-
188
-
189
-
190
-
191
-
192
-
193
-
194
-
195
-
196
-
197
-
198
-
199
-
200
-
201
-
202
-
203
-
204
-
205
-
206
-
207
-
208
-
209
-
210
-
211
-
212
-
213
-
214
-
215
-
216
-
217
-
218
-
219
-
220
-
221
-
222
-
223
-
224
-
225
-
226
-
227
-
228
-
229
-
230
-
231
-
232
-
233
-
234
-
235
-
236
-
237
-
238
-
239
-
240
-
241
-
242
-
243
-
244
-
245
-
246
-
247
-
248
-
249
-
250
-
251
-
252
-
253
-
254
-
255
-
256
-
257
-
258
-
259
-
260
-
261
-
262
-
263
-
264
-
265
-
266
-
267
-
268
-
269
-
270
-
271
-
272
-
273
-
274
-
275
-
276
-
277
-
278
-
279
-
280
-
281
-
282
-
283
-
284
-
285
-
286
-
287
-
288
-
289
-
290
-
291
-
292
-
293
-
294
-
295
-
296
-
297
-
 298
298 -
 299
299 -
 300
300 -
 301
301 -
 302
302 -
 303
303 -
 304
304 -
 305
305 -
 306
306 -
 307
307 -
 308
308 -
 309
309 -
 310
310 -
 311
311 -
 312
312 -
 313
313 -
 314
314 -
 315
315 -
 316
316 -
 317
317 -
 318
318 -
319
-
320
-
321
-
322
-
323
-
324
-
325
-
326
-
327
-
328
-
329
-
330
-
331
-
332
-
333
-
334
-
335
-
336
-
337
-
338
-
339
-
340
-
341
-
342
 |
 |
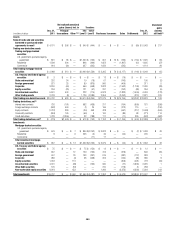
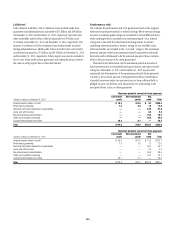
290
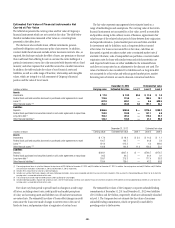
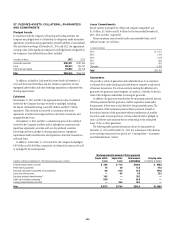
Fair Value (1)
As of December 31, 2012 (in millions) Methodology Input Low High
Loans held-for-sale $747 Price-based Price $ 63.42 $ 100.00
485 External model Credit spread 40 bps 40 bps
174 Recovery analysis
Other real estate owned $165 Price-based Discount to price 11.00% 50.00%
Price (2) $ 39,774 $15,457,452
Loans (3) $351 Price-based Discount to price 25.00% 34.00%
111 Internal model Price (2) $6,272,242 $86,200,000
Discount rate 6.00% 16.49%
(1) The fair value amounts presented in this table represent the primary valuation technique or techniques for each class of assets or liabilities.
(2) Prices are based on appraised values.
(3) Represents loans held for investment whose carrying amounts are based on the fair value of the underlying collateral.
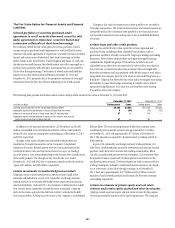
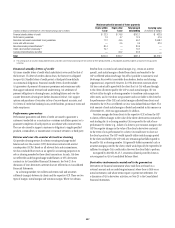
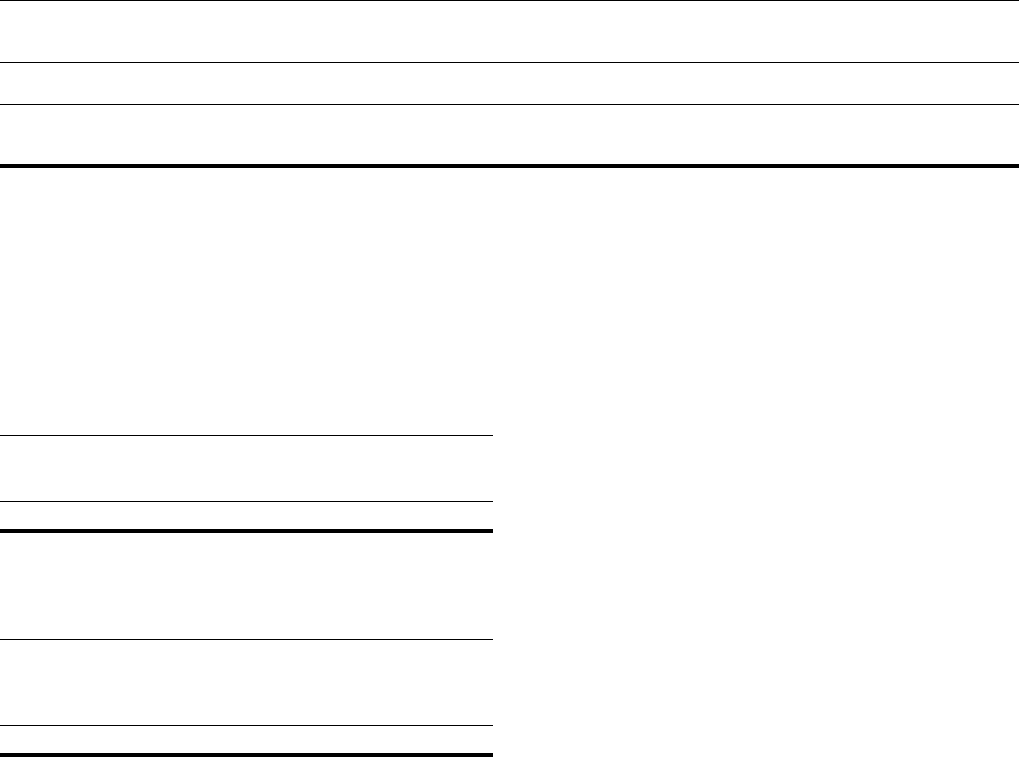
Nonrecurring Fair Value Changes
The following table presents total nonrecurring fair value measurements
for the period, included in earnings, attributable to the change in fair
value relating to assets that are still held at December 31, 2013 and
December 31, 2012:
In millions of dollars
Year ended
December 31, 2013
Loans held-for-sale $ —
Other real estate owned (6)
Loans (1) (761)
Total nonrecurring fair value gains (losses) $(767)
(1) Represents loans held for investment whose carrying amount is based on the fair value of the
underlying collateral, including primarily real-estate loans.
In millions of dollars
Year ended
December 31, 2012
Loans held-for-sale $ (19)
Other real estate owned (29)
Loans (1) (1,489)
Other assets (2) (3,340)
Total nonrecurring fair value gains (losses) $(4,877)
(1) Represents loans held for investment whose carrying amount is based on the fair value of the
underlying collateral, including primarily real-estate loans.
(2) The 12 months ended December 31, 2012 includes the recognition of a $3,340 million impairment
charge related to the carrying value of Citi’s then-remaining 35% interest in MSSB. See Note 14 to the
Consolidated Financial Statements.