Citibank 2013 Annual Report Download - page 49
Download and view the complete annual report
Please find page 49 of the 2013 Citibank annual report below. You can navigate through the pages in the report by either clicking on the pages listed below, or by using the keyword search tool below to find specific information within the annual report.-
 1
1 -
2
-
3
-
4
-
5
-
6
-
7
-
8
-
9
-
10
-
11
-
12
-
13
-
14
-
15
-
16
-
17
-
18
-
19
-
20
-
21
-
22
-
23
-
24
-
25
-
26
-
27
-
28
-
29
-
30
-
31
-
32
-
33
-
34
-
35
-
36
-
37
-
38
-
 39
39 -
 40
40 -
 41
41 -
 42
42 -
 43
43 -
 44
44 -
 45
45 -
 46
46 -
 47
47 -
 48
48 -
 49
49 -
 50
50 -
 51
51 -
 52
52 -
 53
53 -
 54
54 -
 55
55 -
 56
56 -
 57
57 -
 58
58 -
 59
59 -
60
-
61
-
62
-
63
-
64
-
65
-
66
-
67
-
68
-
69
-
70
-
71
-
72
-
73
-
74
-
75
-
76
-
77
-
78
-
79
-
80
-
81
-
82
-
83
-
84
-
85
-
86
-
87
-
88
-
89
-
90
-
91
-
92
-
93
-
94
-
95
-
96
-
97
-
98
-
99
-
100
-
101
-
102
-
103
-
104
-
105
-
106
-
107
-
108
-
109
-
110
-
111
-
112
-
113
-
114
-
115
-
116
-
117
-
118
-
119
-
120
-
121
-
122
-
123
-
124
-
125
-
126
-
127
-
128
-
129
-
130
-
131
-
132
-
133
-
134
-
135
-
136
-
137
-
138
-
139
-
140
-
141
-
142
-
143
-
144
-
145
-
146
-
147
-
148
-
149
-
150
-
151
-
152
-
153
-
154
-
155
-
156
-
157
-
158
-
159
-
160
-
161
-
162
-
163
-
164
-
165
-
166
-
167
-
168
-
169
-
170
-
171
-
172
-
173
-
174
-
175
-
176
-
177
-
178
-
179
-
180
-
181
-
182
-
183
-
184
-
185
-
186
-
187
-
188
-
189
-
190
-
191
-
192
-
193
-
194
-
195
-
196
-
197
-
198
-
199
-
200
-
201
-
202
-
203
-
204
-
205
-
206
-
207
-
208
-
209
-
210
-
211
-
212
-
213
-
214
-
215
-
216
-
217
-
218
-
219
-
220
-
221
-
222
-
223
-
224
-
225
-
226
-
227
-
228
-
229
-
230
-
231
-
232
-
233
-
234
-
235
-
236
-
237
-
238
-
239
-
240
-
241
-
242
-
243
-
244
-
245
-
246
-
247
-
248
-
249
-
250
-
251
-
252
-
253
-
254
-
255
-
256
-
257
-
258
-
259
-
260
-
261
-
262
-
263
-
264
-
265
-
266
-
267
-
268
-
269
-
270
-
271
-
272
-
273
-
274
-
275
-
276
-
277
-
278
-
279
-
280
-
281
-
282
-
283
-
284
-
285
-
286
-
287
-
288
-
289
-
290
-
291
-
292
-
293
-
294
-
295
-
296
-
297
-
298
-
299
-
300
-
301
-
302
-
303
-
304
-
305
-
306
-
307
-
308
-
309
-
310
-
311
-
312
-
313
-
314
-
315
-
316
-
317
-
318
-
319
-
320
-
321
-
322
-
323
-
324
-
325
-
326
-
327
-
328
-
329
-
330
-
331
-
332
-
333
-
334
-
335
-
336
-
337
-
338
-
339
-
340
-
341
-
342
 |
 |
31
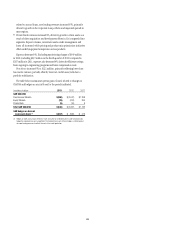
The discussion of the results of operations for Transaction Services below excludes the impact of FX translation for all periods presented. Presentation
of the results of operations, excluding the impact of FX translation, are non-GAAP financial measures. Citi believes the presentation of Transaction
Services’ results excluding the impact of FX translation is a more meaningful depiction of the underlying fundamentals of the business. For a
reconciliation of certain of these metrics to the reported results, see the table above.
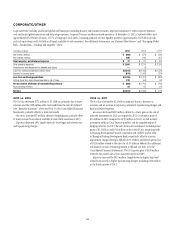
2013 vs. 2012
Net income decreased 12%, primarily due to higher expenses and a higher
effective tax rate (see Note 9 to the Consolidated Financial Statements),
partially offset by lower credit costs.
Revenues were unchanged as growth from higher deposit balances, trade
loans and fees from higher market volumes was offset by continued spread
compression. Treasury and Trade Solutions revenues decreased 1%, as the
ongoing impact of spread compression globally was partially offset by higher
balances and fee growth. Treasury and Trade Solutions average deposits
increased 7% and average trade loans increased 22%, including the impact
of the consolidation of approximately $7 billion of trade loans during the
second quarter of 2013. Securities and Fund Services revenues increased 4%,
as settlement volumes increased 15% and assets under custody increased
10%, partially offset by spread compression related to deposits. Despite the
overall underlying volume growth, Citi expects spread compression will
continue to negatively impact Transaction Services net interest revenues in
the near term.
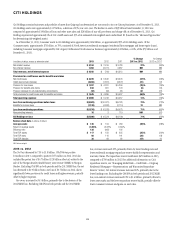
Expenses increased $311 million. The increase was due to an estimated
$360 million charge in the fourth quarter of 2013 related to a fraud
discovered in Banamex in February 2014. Specifically, as more fully described
in Citi’s Form 8-K filed with the Securities and Exchange Commission on
February 28, 2014, as of December 31, 2013, Citi, through Banamex, had
extended approximately $585 million of short-term credit to Oceanografia
S.A. de C.V. (OSA), a Mexican oil services company, through an accounts
receivable financing program. OSA had been a key supplier to Petróleos
Mexicanos (Pemex), the Mexican state-owned oil company, although,
in February 2014, OSA was suspended from being awarded new Mexican
government contracts. Pursuant to the program, Banamex extended credit
to OSA to finance accounts receivables due from Pemex. In February 2014,
Citi discovered that credit had been extended to OSA based on fraudulent
accounts receivable documentation. The estimated $360 million charge
in the fourth quarter of 2013 resulted from the difference between the
$585 million Citi had recorded as owed by Pemex to Citi as of December 31,
2013, and an estimated $185 million that Citi currently believes is owed by
Pemex, with an offset to compensation expense of approximately $40 million
associated with the Banamex variable compensation plan. Excluding the
charge related to the fraud in the fourth quarter of 2013, expenses were
unchanged as volume-related growth and increased financial transaction
taxes in EMEA, which are expected to continue in future periods, were
offset by efficiency savings, lower repositioning charges and lower legal and
related costs.
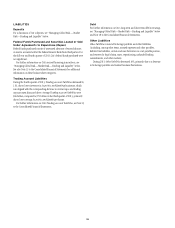
Provisions decreased by 54% due to lower credit costs. As discussed above,
Citi currently believes it is owed approximately $185 million by Pemex
pursuant to the Banamex accounts receivable financing program with
OSA. In addition, as of December 31, 2013, Citi, through Banamex, had
approximately $33 million in either direct obligations of OSA or standby
letters of credit issued on OSA’s behalf. Citi continues to review the events
arising from or relating to the fraud and their potential impacts. Based on
its continued review, Citi will determine whether all or any portion of the
$33 million of direct loans made to OSA and the remaining approximately
$185 million of accounts receivable due from Pemex may be impaired.
Any such impairment would negatively impact provisions in Transaction
Services in future periods.
Average deposits and other customer liabilities increased 8%, primarily as
a result of client activity in Latin America, EMEA and North America (for
additional information on Citi’s deposits, see “Managing Global Risk—
Market Risk—Funding and Liquidity” below).
2012 vs. 2011
Net income increased 9%, reflecting growth in revenues, partially offset by
higher expenses and credit costs.
Revenues increased 5% as higher trade loan and deposit balances were
partially offset by continued spread compression and lower market volumes.
Treasury and Trade Solutions revenues were up 8%, driven by growth in
trade as end-of-period trade loans grew 24%. Cash management revenues
also grew, reflecting growth in deposit balances and fees, partially offset
by continued spread compression due to the continued low interest rate
environment. Securities and Fund Services revenues decreased 2%, primarily
driven by lower market volumes as well as spread compression on deposits.
Expenses increased 2%. Excluding repositioning charges of $134 million
in 2012 (including $95 million in the fourth quarter of 2012) compared
to $60 million in 2011, expenses were unchanged, primarily driven by
incremental investment spending and higher legal and related costs, offset by
efficiency savings.
Average deposits and other customer liabilities grew 14%, driven by
focused deposit building activities as well as continued market demand for
U.S. dollar deposits.