Citibank 2013 Annual Report Download - page 222
Download and view the complete annual report
Please find page 222 of the 2013 Citibank annual report below. You can navigate through the pages in the report by either clicking on the pages listed below, or by using the keyword search tool below to find specific information within the annual report.-
 1
1 -
2
-
3
-
4
-
5
-
6
-
7
-
8
-
9
-
10
-
11
-
12
-
13
-
14
-
15
-
16
-
17
-
18
-
19
-
20
-
21
-
22
-
23
-
24
-
25
-
26
-
27
-
28
-
29
-
30
-
31
-
32
-
33
-
34
-
35
-
36
-
37
-
38
-
39
-
40
-
41
-
42
-
43
-
44
-
45
-
46
-
47
-
48
-
49
-
50
-
51
-
52
-
53
-
54
-
55
-
56
-
57
-
58
-
59
-
60
-
61
-
62
-
63
-
64
-
65
-
66
-
67
-
68
-
69
-
70
-
71
-
72
-
73
-
74
-
75
-
76
-
77
-
78
-
79
-
80
-
81
-
82
-
83
-
84
-
85
-
86
-
87
-
88
-
89
-
90
-
91
-
92
-
93
-
94
-
95
-
96
-
97
-
98
-
99
-
100
-
101
-
102
-
103
-
104
-
105
-
106
-
107
-
108
-
109
-
110
-
111
-
112
-
113
-
114
-
115
-
116
-
117
-
118
-
119
-
120
-
121
-
122
-
123
-
124
-
125
-
126
-
127
-
128
-
129
-
130
-
131
-
132
-
133
-
134
-
135
-
136
-
137
-
138
-
139
-
140
-
141
-
142
-
143
-
144
-
145
-
146
-
147
-
148
-
149
-
150
-
151
-
152
-
153
-
154
-
155
-
156
-
157
-
158
-
159
-
160
-
161
-
162
-
163
-
164
-
165
-
166
-
167
-
168
-
169
-
170
-
171
-
172
-
173
-
174
-
175
-
176
-
177
-
178
-
179
-
180
-
181
-
182
-
183
-
184
-
185
-
186
-
187
-
188
-
189
-
190
-
191
-
192
-
193
-
194
-
195
-
196
-
197
-
198
-
199
-
200
-
201
-
202
-
203
-
204
-
205
-
206
-
207
-
208
-
209
-
210
-
211
-
 212
212 -
 213
213 -
 214
214 -
 215
215 -
 216
216 -
 217
217 -
 218
218 -
 219
219 -
 220
220 -
 221
221 -
 222
222 -
 223
223 -
 224
224 -
 225
225 -
 226
226 -
 227
227 -
 228
228 -
 229
229 -
 230
230 -
 231
231 -
 232
232 -
233
-
234
-
235
-
236
-
237
-
238
-
239
-
240
-
241
-
242
-
243
-
244
-
245
-
246
-
247
-
248
-
249
-
250
-
251
-
252
-
253
-
254
-
255
-
256
-
257
-
258
-
259
-
260
-
261
-
262
-
263
-
264
-
265
-
266
-
267
-
268
-
269
-
270
-
271
-
272
-
273
-
274
-
275
-
276
-
277
-
278
-
279
-
280
-
281
-
282
-
283
-
284
-
285
-
286
-
287
-
288
-
289
-
290
-
291
-
292
-
293
-
294
-
295
-
296
-
297
-
298
-
299
-
300
-
301
-
302
-
303
-
304
-
305
-
306
-
307
-
308
-
309
-
310
-
311
-
312
-
313
-
314
-
315
-
316
-
317
-
318
-
319
-
320
-
321
-
322
-
323
-
324
-
325
-
326
-
327
-
328
-
329
-
330
-
331
-
332
-
333
-
334
-
335
-
336
-
337
-
338
-
339
-
340
-
341
-
342
 |
 |
204
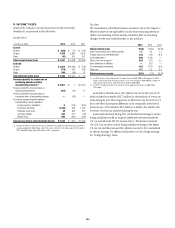
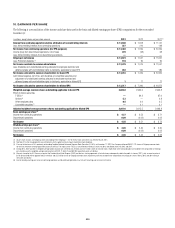
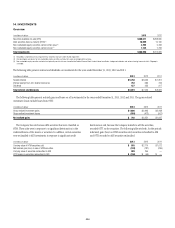
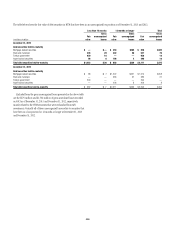
14. INVESTMENTS
Overview
In millions of dollars 2013 2012
Securities available-for-sale (AFS) $286,511 $288,695
Debt securities held-to-maturity (HTM) (1) 10,599 10,130
Non-marketable equity securities carried at fair value (2) 4,705 5,768
Non-marketable equity securities carried at cost (3) 7,165 7,733
Total investments $308,980 $312,326
(1) Recorded at amortized cost less impairment for securities that have credit-related impairment.
(2) Unrealized gains and losses for non-marketable equity securities carried at fair value are recognized in earnings.
(3) Non-marketable equity securities carried at cost primarily consist of shares issued by the Federal Reserve Bank, Federal Home Loan Banks, foreign central banks and various clearing houses of which Citigroup is
a member.
The following table presents interest and dividends on investments for the years ended December 31, 2013, 2012 and 2011:
In millions of dollars 2013 2012 2011
Taxable interest $ 5,750 $ 6,509 $ 7,257
Interest exempt from U.S. federal income tax 732 683 746
Dividends 437 333 317
Total interest and dividends $6,919 $ 7,525 $ 8,320
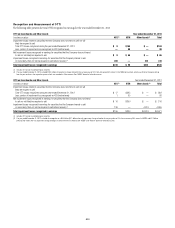
The following table presents realized gains and losses on all investments for the years ended December 31, 2013, 2012 and 2011. The gross realized
investment losses exclude losses from OTTI:
In millions of dollars 2013 2012 2011
Gross realized investment gains $1,606 $ 3,663 $ 2,498
Gross realized investment losses (858) (412) (501)
Net realized gains $ 748 $ 3,251 $ 1,997
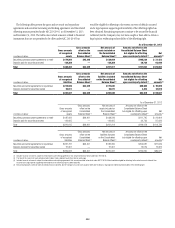
The Company has sold various debt securities that were classified as
HTM. These sales were in response to a significant deterioration in the
creditworthiness of the issuers or securities. In addition, certain securities
were reclassified to AFS investments in response to significant credit
deterioration and, because the Company intends to sell the securities,
recorded OTTI on the securities. The following table sets forth, for the periods
indicated, gain (loss) on HTM securities sold, securities reclassified to AFS
and OTTI recorded on AFS securities reclassified.
In millions of dollars 2013 2012 2011
Carrying value of HTM securities sold $ 935 $ 2,110 $ 1,612
Net realized gain (loss) on sale of HTM securities (128) (187) (299)
Carrying value of securities reclassified to AFS 989 244 —
OTTI losses on securities reclassified to AFS $ (156) $ (59) $ —