Citibank 2013 Annual Report Download - page 297
Download and view the complete annual report
Please find page 297 of the 2013 Citibank annual report below. You can navigate through the pages in the report by either clicking on the pages listed below, or by using the keyword search tool below to find specific information within the annual report.-
 1
1 -
2
-
3
-
4
-
5
-
6
-
7
-
8
-
9
-
10
-
11
-
12
-
13
-
14
-
15
-
16
-
17
-
18
-
19
-
20
-
21
-
22
-
23
-
24
-
25
-
26
-
27
-
28
-
29
-
30
-
31
-
32
-
33
-
34
-
35
-
36
-
37
-
38
-
39
-
40
-
41
-
42
-
43
-
44
-
45
-
46
-
47
-
48
-
49
-
50
-
51
-
52
-
53
-
54
-
55
-
56
-
57
-
58
-
59
-
60
-
61
-
62
-
63
-
64
-
65
-
66
-
67
-
68
-
69
-
70
-
71
-
72
-
73
-
74
-
75
-
76
-
77
-
78
-
79
-
80
-
81
-
82
-
83
-
84
-
85
-
86
-
87
-
88
-
89
-
90
-
91
-
92
-
93
-
94
-
95
-
96
-
97
-
98
-
99
-
100
-
101
-
102
-
103
-
104
-
105
-
106
-
107
-
108
-
109
-
110
-
111
-
112
-
113
-
114
-
115
-
116
-
117
-
118
-
119
-
120
-
121
-
122
-
123
-
124
-
125
-
126
-
127
-
128
-
129
-
130
-
131
-
132
-
133
-
134
-
135
-
136
-
137
-
138
-
139
-
140
-
141
-
142
-
143
-
144
-
145
-
146
-
147
-
148
-
149
-
150
-
151
-
152
-
153
-
154
-
155
-
156
-
157
-
158
-
159
-
160
-
161
-
162
-
163
-
164
-
165
-
166
-
167
-
168
-
169
-
170
-
171
-
172
-
173
-
174
-
175
-
176
-
177
-
178
-
179
-
180
-
181
-
182
-
183
-
184
-
185
-
186
-
187
-
188
-
189
-
190
-
191
-
192
-
193
-
194
-
195
-
196
-
197
-
198
-
199
-
200
-
201
-
202
-
203
-
204
-
205
-
206
-
207
-
208
-
209
-
210
-
211
-
212
-
213
-
214
-
215
-
216
-
217
-
218
-
219
-
220
-
221
-
222
-
223
-
224
-
225
-
226
-
227
-
228
-
229
-
230
-
231
-
232
-
233
-
234
-
235
-
236
-
237
-
238
-
239
-
240
-
241
-
242
-
243
-
244
-
245
-
246
-
247
-
248
-
249
-
250
-
251
-
252
-
253
-
254
-
255
-
256
-
257
-
258
-
259
-
260
-
261
-
262
-
263
-
264
-
265
-
266
-
267
-
268
-
269
-
270
-
271
-
272
-
273
-
274
-
275
-
276
-
277
-
278
-
279
-
280
-
281
-
282
-
283
-
284
-
285
-
286
-
 287
287 -
 288
288 -
 289
289 -
 290
290 -
 291
291 -
 292
292 -
 293
293 -
 294
294 -
 295
295 -
 296
296 -
 297
297 -
 298
298 -
 299
299 -
 300
300 -
 301
301 -
 302
302 -
 303
303 -
 304
304 -
 305
305 -
 306
306 -
 307
307 -
308
-
309
-
310
-
311
-
312
-
313
-
314
-
315
-
316
-
317
-
318
-
319
-
320
-
321
-
322
-
323
-
324
-
325
-
326
-
327
-
328
-
329
-
330
-
331
-
332
-
333
-
334
-
335
-
336
-
337
-
338
-
339
-
340
-
341
-
342
 |
 |

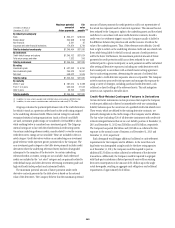
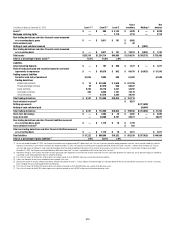
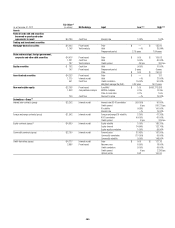
279
In millions of dollars
Dec. 31,
2012
Net realized/unrealized
gains (losses) incl. in Transfers
Purchases Issuances Sales Settlements
Dec. 31,
2013
Unrealized
gains
(losses)
still held (3)
Principal
transactions Other (1)(2)
into
Level 3
out of
Level 3
Investments
Mortgage-backed securities
U.S. government-sponsored
agency guaranteed $ 1,458 $ — $ (7) $ 2,058 $(3,820) $ 593 $ — $ (38) $ (57) $ 187 $ 11
Residential 205 — 30 60 (265) 212 — (140) — 102 7
Commercial — — — 4 (21) 17 — — — — —
Total investment mortgage-
backed securities $ 1,663 $ — $ 23 $ 2,122 $(4,106) $ 822 $ — $ (178) $ (57) $ 289 $ 18
U.S. Treasury and federal
agency securities $ 12 $ — $ — $ — $ — $ — $ — $ (4) $ — $ 8 $ —
State and municipal 849 — 10 12 (122) 1,236 — (217) (125) 1,643 (75)
Foreign government 383 — 2 178 (256) 506 — (391) (78) 344 (28)
Corporate 385 — (27) 334 (119) 104 — (303) (89) 285 —
Equity securities 773 — 56 19 (1) 1 — (33) — 815 47
Asset-backed securities 2,220 — 117 1,192 (1,684) 1,475 — (337) (1,023) 1,960 —
Other debt securities 258 — — — (205) 50 — (53) — 50 —
Non-marketable equity securities 5,364 — 249 — — 653 — (342) (1,577) 4,347 241
Total investments $11,907 $ — $ 430 $ 3,857 $(6,493) $ 4,847 $ — $ (1,858) $(2,949) $ 9,741 $ 203
Loans $ 4,931 $ — $ (24) $ 353 $ — $ 179 $ 652 $ (192) $(1,756) $ 4,143 $(122)
Mortgage servicing rights 1,942 — 555 — — — 634 (2) (411) 2,718 553
Other financial assets
measured on a recurring basis 2,452 — 63 1 — 216 474 (2,046) (979) 181 (5)
Liabilities
Interest-bearing deposits $ 786 $ — $(125) $ 32 $ (21) $ — $ 86 $ — $ (118) $ 890 $ (41)
Federal funds purchased and
securities loaned or sold under
agreements to repurchase 841 91 — 216 (17) 36 — 40 (123) 902 50
Trading account liabilities
Securities sold, not yet purchased 365 42 — 89 (52) — — 612 (382) 590 73
Short-term borrowings 112 53 — 2 (10) — 316 — (338) 29 (5)
Long-term debt 6,726 (161) 153 2,461 (2,531) — 1,466 (1) (1,332) 6,797 (55)
Other financial liabilities measured
on a recurring basis 24 — (215) 5 (2) (5) 104 — (331) 10 (9)
(1) Changes in fair value for available-for-sale investments are recorded in Accumulated other comprehensive income (loss), unless other-than-temporarily impaired, while gains and losses from sales are recorded in
Realized gains (losses) from sales of investments on the Consolidated Statement of Income.
(2) Unrealized gains (losses) on MSRs are recorded in Other revenue on the Consolidated Statement of Income.
(3) Represents the amount of total gains or losses for the period, included in earnings (and Accumulated other comprehensive income (loss) for changes in fair value for available-for-sale investments), attributable to the
change in fair value relating to assets and liabilities classified as Level 3 that are still held at December 31, 2013.
(4) Total Level 3 derivative assets and liabilities have been netted in these tables for presentation purposes only.