Citibank 2013 Annual Report Download - page 36
Download and view the complete annual report
Please find page 36 of the 2013 Citibank annual report below. You can navigate through the pages in the report by either clicking on the pages listed below, or by using the keyword search tool below to find specific information within the annual report.-
 1
1 -
2
-
3
-
4
-
5
-
6
-
7
-
8
-
9
-
10
-
11
-
12
-
13
-
14
-
15
-
16
-
17
-
18
-
19
-
20
-
21
-
22
-
23
-
24
-
25
-
 26
26 -
 27
27 -
 28
28 -
 29
29 -
 30
30 -
 31
31 -
 32
32 -
 33
33 -
 34
34 -
 35
35 -
 36
36 -
 37
37 -
 38
38 -
 39
39 -
 40
40 -
 41
41 -
 42
42 -
 43
43 -
 44
44 -
 45
45 -
 46
46 -
47
-
48
-
49
-
50
-
51
-
52
-
53
-
54
-
55
-
56
-
57
-
58
-
59
-
60
-
61
-
62
-
63
-
64
-
65
-
66
-
67
-
68
-
69
-
70
-
71
-
72
-
73
-
74
-
75
-
76
-
77
-
78
-
79
-
80
-
81
-
82
-
83
-
84
-
85
-
86
-
87
-
88
-
89
-
90
-
91
-
92
-
93
-
94
-
95
-
96
-
97
-
98
-
99
-
100
-
101
-
102
-
103
-
104
-
105
-
106
-
107
-
108
-
109
-
110
-
111
-
112
-
113
-
114
-
115
-
116
-
117
-
118
-
119
-
120
-
121
-
122
-
123
-
124
-
125
-
126
-
127
-
128
-
129
-
130
-
131
-
132
-
133
-
134
-
135
-
136
-
137
-
138
-
139
-
140
-
141
-
142
-
143
-
144
-
145
-
146
-
147
-
148
-
149
-
150
-
151
-
152
-
153
-
154
-
155
-
156
-
157
-
158
-
159
-
160
-
161
-
162
-
163
-
164
-
165
-
166
-
167
-
168
-
169
-
170
-
171
-
172
-
173
-
174
-
175
-
176
-
177
-
178
-
179
-
180
-
181
-
182
-
183
-
184
-
185
-
186
-
187
-
188
-
189
-
190
-
191
-
192
-
193
-
194
-
195
-
196
-
197
-
198
-
199
-
200
-
201
-
202
-
203
-
204
-
205
-
206
-
207
-
208
-
209
-
210
-
211
-
212
-
213
-
214
-
215
-
216
-
217
-
218
-
219
-
220
-
221
-
222
-
223
-
224
-
225
-
226
-
227
-
228
-
229
-
230
-
231
-
232
-
233
-
234
-
235
-
236
-
237
-
238
-
239
-
240
-
241
-
242
-
243
-
244
-
245
-
246
-
247
-
248
-
249
-
250
-
251
-
252
-
253
-
254
-
255
-
256
-
257
-
258
-
259
-
260
-
261
-
262
-
263
-
264
-
265
-
266
-
267
-
268
-
269
-
270
-
271
-
272
-
273
-
274
-
275
-
276
-
277
-
278
-
279
-
280
-
281
-
282
-
283
-
284
-
285
-
286
-
287
-
288
-
289
-
290
-
291
-
292
-
293
-
294
-
295
-
296
-
297
-
298
-
299
-
300
-
301
-
302
-
303
-
304
-
305
-
306
-
307
-
308
-
309
-
310
-
311
-
312
-
313
-
314
-
315
-
316
-
317
-
318
-
319
-
320
-
321
-
322
-
323
-
324
-
325
-
326
-
327
-
328
-
329
-
330
-
331
-
332
-
333
-
334
-
335
-
336
-
337
-
338
-
339
-
340
-
341
-
342
 |
 |

18
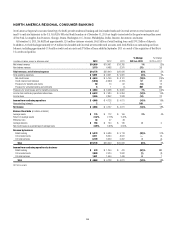
NORTH AMERICA REGIONAL CONSUMER BANKING
North America Regional Consumer Banking (NA RCB) provides traditional banking and Citi-branded cards and Citi retail services to retail customers and
small- to mid-size businesses in the U.S. NA RCB’s 983 retail bank branches as of December 31, 2013 are largely concentrated in the greater metropolitan areas
of New York, Los Angeles, San Francisco, Chicago, Miami, Washington, D.C., Boston, Philadelphia, Dallas, Houston, San Antonio and Austin.
At December 31, 2013, NA RCB had approximately 12.0 million customer accounts, $44.1 billion of retail banking loans and $170.2 billion of deposits.
In addition, NA RCB had approximately 113.9 million Citi-branded and Citi retail services credit card accounts, with $116.8 billion in outstanding card loan
balances, including approximately 13.0 million credit card accounts and $7 billion of loans added in September 2013 as a result of the acquisition of Best Buy’s
U.S. credit card portfolio.
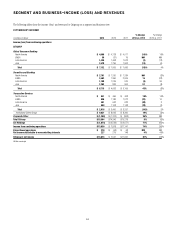
In millions of dollars, except as otherwise noted 2013 2012 2011
% Change
2013 vs. 2012
% Change
2012 vs. 2011
Net interest revenue $16,659 $ 16,461 $ 16,785 1% (2)%
Non-interest revenue 3,119 4,488 3,241 (31) 38
Total revenues, net of interest expense $19,778 $ 20,949 $20,026 (6)% 5%
Total operating expenses $ 9,591 $ 9,931 $ 9,691 (3)% 2%
Net credit losses $ 4,634 $ 5,756 $ 8,101 (19)% (29)%
Credit reserve build (release) (1,036) (2,389) (4,181) 57 43
Provisions for benefits and claims 60 70 62 (14) 13
Provision for unfunded lending commitments 61 (1) NM NM
Provisions for credit losses and for benefits and claims $ 3,664 $ 3,438 $ 3,981 7% (14)%
Income from continuing operations before taxes $ 6,523 $ 7,580 $ 6,354 (14)% 19%
Income taxes 2,455 2,852 2,343 (14) 22
Income from continuing operations $ 4,068 $ 4,728 $ 4,011 (14)% 18%
Noncontrolling interests 21 — 100 —
Net income $ 4,066 $ 4,727 $ 4,011 (14)% 18%
Balance Sheet data (in billions of dollars)
Average assets $ 175 $ 172 $ 166 2% 4%
Return on average assets 2.32% 2.75% 2.42%
Efficiency ratio 48 47 48
Average deposits $ 166 $ 154 $ 145 86
Net credit losses as a percentage of average loans 3.09% 3.83% 5.50%
Revenue by business
Retail banking $ 5,378 $ 6,686 $ 5,118 (20)% 31%
Citi-branded cards 8,211 8,234 8,641 —(5)
Citi retail services 6,189 6,029 6,267 3(4)
Total $19,778 $ 20,949 $ 20,026 (6)% 5%
Income from continuing operations by business
Retail banking $ 478 $ 1,244 $ 470 (62)% NM
Citi-branded cards 2,009 2,020 2,092 (1) (3)
Citi retail services 1,581 1,464 1,449 81
Total $ 4,068 $ 4,728 $ 4,011 (14)% 18%
NM Not meaningful