Citibank 2013 Annual Report Download - page 152
Download and view the complete annual report
Please find page 152 of the 2013 Citibank annual report below. You can navigate through the pages in the report by either clicking on the pages listed below, or by using the keyword search tool below to find specific information within the annual report.-
 1
1 -
2
-
3
-
4
-
5
-
6
-
7
-
8
-
9
-
10
-
11
-
12
-
13
-
14
-
15
-
16
-
17
-
18
-
19
-
20
-
21
-
22
-
23
-
24
-
25
-
26
-
27
-
28
-
29
-
30
-
31
-
32
-
33
-
34
-
35
-
36
-
37
-
38
-
39
-
40
-
41
-
42
-
43
-
44
-
45
-
46
-
47
-
48
-
49
-
50
-
51
-
52
-
53
-
54
-
55
-
56
-
57
-
58
-
59
-
60
-
61
-
62
-
63
-
64
-
65
-
66
-
67
-
68
-
69
-
70
-
71
-
72
-
73
-
74
-
75
-
76
-
77
-
78
-
79
-
80
-
81
-
82
-
83
-
84
-
85
-
86
-
87
-
88
-
89
-
90
-
91
-
92
-
93
-
94
-
95
-
96
-
97
-
98
-
99
-
100
-
101
-
102
-
103
-
104
-
105
-
106
-
107
-
108
-
109
-
110
-
111
-
112
-
113
-
114
-
115
-
116
-
117
-
118
-
119
-
120
-
121
-
122
-
123
-
124
-
125
-
126
-
127
-
128
-
129
-
130
-
131
-
132
-
133
-
134
-
135
-
136
-
137
-
138
-
139
-
140
-
141
-
 142
142 -
 143
143 -
 144
144 -
 145
145 -
 146
146 -
 147
147 -
 148
148 -
 149
149 -
 150
150 -
 151
151 -
 152
152 -
 153
153 -
 154
154 -
 155
155 -
 156
156 -
 157
157 -
 158
158 -
 159
159 -
 160
160 -
 161
161 -
 162
162 -
163
-
164
-
165
-
166
-
167
-
168
-
169
-
170
-
171
-
172
-
173
-
174
-
175
-
176
-
177
-
178
-
179
-
180
-
181
-
182
-
183
-
184
-
185
-
186
-
187
-
188
-
189
-
190
-
191
-
192
-
193
-
194
-
195
-
196
-
197
-
198
-
199
-
200
-
201
-
202
-
203
-
204
-
205
-
206
-
207
-
208
-
209
-
210
-
211
-
212
-
213
-
214
-
215
-
216
-
217
-
218
-
219
-
220
-
221
-
222
-
223
-
224
-
225
-
226
-
227
-
228
-
229
-
230
-
231
-
232
-
233
-
234
-
235
-
236
-
237
-
238
-
239
-
240
-
241
-
242
-
243
-
244
-
245
-
246
-
247
-
248
-
249
-
250
-
251
-
252
-
253
-
254
-
255
-
256
-
257
-
258
-
259
-
260
-
261
-
262
-
263
-
264
-
265
-
266
-
267
-
268
-
269
-
270
-
271
-
272
-
273
-
274
-
275
-
276
-
277
-
278
-
279
-
280
-
281
-
282
-
283
-
284
-
285
-
286
-
287
-
288
-
289
-
290
-
291
-
292
-
293
-
294
-
295
-
296
-
297
-
298
-
299
-
300
-
301
-
302
-
303
-
304
-
305
-
306
-
307
-
308
-
309
-
310
-
311
-
312
-
313
-
314
-
315
-
316
-
317
-
318
-
319
-
320
-
321
-
322
-
323
-
324
-
325
-
326
-
327
-
328
-
329
-
330
-
331
-
332
-
333
-
334
-
335
-
336
-
337
-
338
-
339
-
340
-
341
-
342
 |
 |

134
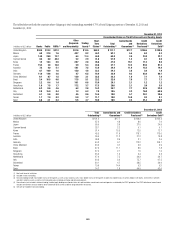
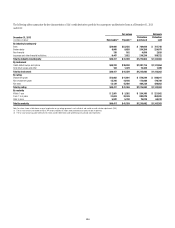
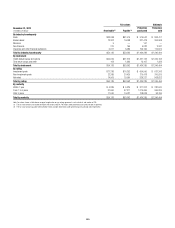
The following tables summarize the key characteristics of Citi’s credit derivatives portfolio by counterparty and derivative form as of December 31, 2013
and 2012:
Fair values Notionals
December 31, 2013
In millions of dollars Receivable (1) Payable (2)
Protection
purchased
Protection
sold
By industry/counterparty
Bank $24,992 $23,455 $ 739,646 $ 727,748
Broker-dealer 8,840 9,820 254,250 224,073
Non-financial 138 162 4,930 2,820
Insurance and other financial institutions 6,447 7,922 216,236 188,722
Total by industry/counterparty $40,417 $41,359 $1,215,062 $1,143,363
By instrument
Credit default swaps and options $40,233 $39,930 $1,201,716 $1,141,864
Total return swaps and other 184 1,429 13,346 1,499
Total by instrument $40,417 $41,359 $1,215,062 $1,143,363
By rating
Investment grade $12,062 $11,691 $ 576,844 $ 546,011
Non-investment grade 15,216 14,188 173,980 170,789
Not rated 13,139 15,480 464,238 426,563
Total by rating $40,417 $41,359 $1,215,062 $1,143,363
By maturity
Within 1 year $ 2,901 $ 3,262 $ 254,305 $ 221,562
From 1 to 5 years 31,674 32,349 883,879 853,391
After 5 years 5,842 5,748 76,878 68,410
Total by maturity $40,417 $41,359 $1,215,062 $1,143,363
Note: Fair values shown in table above are prior to application of any netting agreements, cash collateral, and market or credit valuation adjustments (CVA).
(1) The fair value amounts receivable were $13,744 million and $26,673 million under protection purchased and sold, respectively.
(2) The fair value amounts payable were $28,723 million and $12,636 million under protection purchased and sold, respectively.