Citibank 2013 Annual Report Download - page 125
Download and view the complete annual report
Please find page 125 of the 2013 Citibank annual report below. You can navigate through the pages in the report by either clicking on the pages listed below, or by using the keyword search tool below to find specific information within the annual report.-
 1
1 -
2
-
3
-
4
-
5
-
6
-
7
-
8
-
9
-
10
-
11
-
12
-
13
-
14
-
15
-
16
-
17
-
18
-
19
-
20
-
21
-
22
-
23
-
24
-
25
-
26
-
27
-
28
-
29
-
30
-
31
-
32
-
33
-
34
-
35
-
36
-
37
-
38
-
39
-
40
-
41
-
42
-
43
-
44
-
45
-
46
-
47
-
48
-
49
-
50
-
51
-
52
-
53
-
54
-
55
-
56
-
57
-
58
-
59
-
60
-
61
-
62
-
63
-
64
-
65
-
66
-
67
-
68
-
69
-
70
-
71
-
72
-
73
-
74
-
75
-
76
-
77
-
78
-
79
-
80
-
81
-
82
-
83
-
84
-
85
-
86
-
87
-
88
-
89
-
90
-
91
-
92
-
93
-
94
-
95
-
96
-
97
-
98
-
99
-
100
-
101
-
102
-
103
-
104
-
105
-
106
-
107
-
108
-
109
-
110
-
111
-
112
-
113
-
114
-
 115
115 -
 116
116 -
 117
117 -
 118
118 -
 119
119 -
 120
120 -
 121
121 -
 122
122 -
 123
123 -
 124
124 -
 125
125 -
 126
126 -
 127
127 -
 128
128 -
 129
129 -
 130
130 -
 131
131 -
 132
132 -
 133
133 -
 134
134 -
 135
135 -
136
-
137
-
138
-
139
-
140
-
141
-
142
-
143
-
144
-
145
-
146
-
147
-
148
-
149
-
150
-
151
-
152
-
153
-
154
-
155
-
156
-
157
-
158
-
159
-
160
-
161
-
162
-
163
-
164
-
165
-
166
-
167
-
168
-
169
-
170
-
171
-
172
-
173
-
174
-
175
-
176
-
177
-
178
-
179
-
180
-
181
-
182
-
183
-
184
-
185
-
186
-
187
-
188
-
189
-
190
-
191
-
192
-
193
-
194
-
195
-
196
-
197
-
198
-
199
-
200
-
201
-
202
-
203
-
204
-
205
-
206
-
207
-
208
-
209
-
210
-
211
-
212
-
213
-
214
-
215
-
216
-
217
-
218
-
219
-
220
-
221
-
222
-
223
-
224
-
225
-
226
-
227
-
228
-
229
-
230
-
231
-
232
-
233
-
234
-
235
-
236
-
237
-
238
-
239
-
240
-
241
-
242
-
243
-
244
-
245
-
246
-
247
-
248
-
249
-
250
-
251
-
252
-
253
-
254
-
255
-
256
-
257
-
258
-
259
-
260
-
261
-
262
-
263
-
264
-
265
-
266
-
267
-
268
-
269
-
270
-
271
-
272
-
273
-
274
-
275
-
276
-
277
-
278
-
279
-
280
-
281
-
282
-
283
-
284
-
285
-
286
-
287
-
288
-
289
-
290
-
291
-
292
-
293
-
294
-
295
-
296
-
297
-
298
-
299
-
300
-
301
-
302
-
303
-
304
-
305
-
306
-
307
-
308
-
309
-
310
-
311
-
312
-
313
-
314
-
315
-
316
-
317
-
318
-
319
-
320
-
321
-
322
-
323
-
324
-
325
-
326
-
327
-
328
-
329
-
330
-
331
-
332
-
333
-
334
-
335
-
336
-
337
-
338
-
339
-
340
-
341
-
342
 |
 |
107
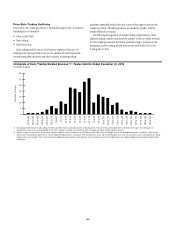
Price Risk
Price risk losses arise from fluctuations in the market value of trading
and non-trading positions resulting from changes in interest rates, credit
spreads, foreign exchange rates, equity and commodity prices, and in their
implied volatilities.
Price Risk Measurement and Stress Testing
Price risks are measured in accordance with established standards to
ensure consistency across businesses and the ability to aggregate risk.
The measurement used for non-trading and trading portfolios, as well as
associated stress testing processes, are described below.
Price Risk—Non-Trading Portfolios
Net Interest Revenue and Interest Rate Risk
Net interest revenue (NIR), for interest rate exposure purposes, is the
difference between the yield earned on the non-trading portfolio assets
(including customer loans) and the rate paid on the liabilities (including
customer deposits or company borrowings). NIR is affected by changes in the
level of interest rates, as well as the amounts of assets and liabilities, and the
timing of repricing of assets and liabilities to reflect market rates.
Interest Rate Risk Measurement
Citi’s principal measure of risk to NIR is interest rate exposure (IRE). IRE
measures the change in expected NIR in each currency resulting solely from
unanticipated changes in forward interest rates. Factors such as changes
in volumes, credit spreads, margins and the impact of prior-period pricing
decisions are not captured by IRE. IRE also assumes that businesses make no
additional changes in pricing or balances in response to the unanticipated
rate changes.
For example, if the current 90-day LIBOR rate is 3% and the one-
year-forward rate (i.e., the estimated 90-day LIBOR rate in one year) is
5%, the +100 bps IRE scenario measures the impact on NIR of a 100 bps
instantaneous change in the 90-day LIBOR to 6% in one year.
The impact of changing prepayment rates on loan portfolios is
incorporated into the results. For example, in the declining interest rate
scenarios, it is assumed that mortgage portfolios prepay faster and that
income is reduced. In addition, in a rising interest rate scenario, portions of
the deposit portfolio are assumed to experience rate increases that may be less
than the change in market interest rates.
Mitigation and Hedging of Interest Rate Risk
In order to manage changes in interest rates effectively, Citi may modify
pricing on new customer loans and deposits, enter into transactions with
other institutions or enter into derivative transactions that have the opposite
risk exposures. Citi regularly assesses the viability of these and other strategies
to reduce its interest rate risks and implements such strategies when it
believes those actions are prudent. Such strategies are not included in the
estimation of IRE.
Stress Testing
Citigroup employs additional measurements, including stress testing the
impact of non-linear interest rate movements on the value of the balance
sheet; the analysis of portfolio duration and volatility, particularly as they
relate to mortgage loans and mortgage-backed securities; and the potential
impact of the change in the spread between different market indices.
Changes in Interest Rates—Impacts on Net Interest Revenue, Other
Comprehensive Income and Capital
Citi measures the potential impacts of changes in interest rates on Citi’s net
interest revenue and value of its other comprehensive income (OCI), which
can in turn impact Citi’s estimated Basel III Tier 1 Common ratio. Citi’s
goal is to benefit from an increase in the market level of interest rates, while
limiting the impact of changes in OCI on its regulatory capital position.
Citi manages interest rate risk as a consolidated net position. Citi’s client-
facing businesses create interest rate sensitive-positions, including loans and
deposits, as part of their ongoing activities. Citi Treasury accumulates these
risk positions and manages them centrally. Operating within established
limits, Citi Treasury makes positioning decisions and uses tools, such as Citi’s
investment securities portfolio, firm-issued debt, and interest rate derivatives,
to target the desired risk profile. Changes in Citi’s interest rate risk position
reflect the accumulated changes in all non-trading assets and liabilities,
with potentially large and offsetting impacts, as well as Citi Treasury’s
positioning decisions.
OCI at risk is managed as part of the firm-wide interest rate risk position.
OCI at risk considers potential changes in OCI (and the corresponding
impact on the estimated Basel III Tier 1 Common ratio) relative to Citi’s
capital generation capacity.