Citibank 2013 Annual Report Download - page 29
Download and view the complete annual report
Please find page 29 of the 2013 Citibank annual report below. You can navigate through the pages in the report by either clicking on the pages listed below, or by using the keyword search tool below to find specific information within the annual report.-
 1
1 -
2
-
3
-
4
-
5
-
6
-
7
-
8
-
9
-
10
-
11
-
12
-
13
-
14
-
15
-
16
-
17
-
18
-
 19
19 -
 20
20 -
 21
21 -
 22
22 -
 23
23 -
 24
24 -
 25
25 -
 26
26 -
 27
27 -
 28
28 -
 29
29 -
 30
30 -
 31
31 -
 32
32 -
 33
33 -
 34
34 -
 35
35 -
 36
36 -
 37
37 -
 38
38 -
 39
39 -
40
-
41
-
42
-
43
-
44
-
45
-
46
-
47
-
48
-
49
-
50
-
51
-
52
-
53
-
54
-
55
-
56
-
57
-
58
-
59
-
60
-
61
-
62
-
63
-
64
-
65
-
66
-
67
-
68
-
69
-
70
-
71
-
72
-
73
-
74
-
75
-
76
-
77
-
78
-
79
-
80
-
81
-
82
-
83
-
84
-
85
-
86
-
87
-
88
-
89
-
90
-
91
-
92
-
93
-
94
-
95
-
96
-
97
-
98
-
99
-
100
-
101
-
102
-
103
-
104
-
105
-
106
-
107
-
108
-
109
-
110
-
111
-
112
-
113
-
114
-
115
-
116
-
117
-
118
-
119
-
120
-
121
-
122
-
123
-
124
-
125
-
126
-
127
-
128
-
129
-
130
-
131
-
132
-
133
-
134
-
135
-
136
-
137
-
138
-
139
-
140
-
141
-
142
-
143
-
144
-
145
-
146
-
147
-
148
-
149
-
150
-
151
-
152
-
153
-
154
-
155
-
156
-
157
-
158
-
159
-
160
-
161
-
162
-
163
-
164
-
165
-
166
-
167
-
168
-
169
-
170
-
171
-
172
-
173
-
174
-
175
-
176
-
177
-
178
-
179
-
180
-
181
-
182
-
183
-
184
-
185
-
186
-
187
-
188
-
189
-
190
-
191
-
192
-
193
-
194
-
195
-
196
-
197
-
198
-
199
-
200
-
201
-
202
-
203
-
204
-
205
-
206
-
207
-
208
-
209
-
210
-
211
-
212
-
213
-
214
-
215
-
216
-
217
-
218
-
219
-
220
-
221
-
222
-
223
-
224
-
225
-
226
-
227
-
228
-
229
-
230
-
231
-
232
-
233
-
234
-
235
-
236
-
237
-
238
-
239
-
240
-
241
-
242
-
243
-
244
-
245
-
246
-
247
-
248
-
249
-
250
-
251
-
252
-
253
-
254
-
255
-
256
-
257
-
258
-
259
-
260
-
261
-
262
-
263
-
264
-
265
-
266
-
267
-
268
-
269
-
270
-
271
-
272
-
273
-
274
-
275
-
276
-
277
-
278
-
279
-
280
-
281
-
282
-
283
-
284
-
285
-
286
-
287
-
288
-
289
-
290
-
291
-
292
-
293
-
294
-
295
-
296
-
297
-
298
-
299
-
300
-
301
-
302
-
303
-
304
-
305
-
306
-
307
-
308
-
309
-
310
-
311
-
312
-
313
-
314
-
315
-
316
-
317
-
318
-
319
-
320
-
321
-
322
-
323
-
324
-
325
-
326
-
327
-
328
-
329
-
330
-
331
-
332
-
333
-
334
-
335
-
336
-
337
-
338
-
339
-
340
-
341
-
342
 |
 |

11
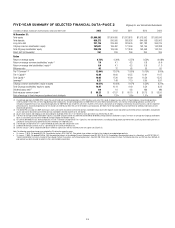
FIVE-YEAR SUMMARY OF SELECTED FINANCIAL DATA—PAGE 2
In millions of dollars, except per-share amounts, ratios and direct staff 2013 2012 2011 2010 2009
At December 31:
Total assets $1,880,382 $1,864,660 $1,873,878 $1,913,902 $1,856,646
Total deposits 968,273 930,560 865,936 844,968 835,903
Long-term debt 221,116 239,463 323,505 381,183 364,019
Citigroup common stockholders’ equity 197,601 186,487 177,494 163,156 152,388
Total Citigroup stockholders’ equity 204,339 189,049 177,806 163,468 152,700
Direct staff (in thousands) 251 259 266 260 265
Ratios
Return on average assets 0.73% 0.39% 0.55% 0.53% (0.08)%
Return on average common stockholders’ equity (4) 7.0 4.1 6.3 6.8 (9.4)
Return on average total stockholders’ equity (4) 6.9 4.1 6.3 6.8 (1.1)
Efficiency ratio 63 72 65 55 60
Tier 1 Common (5) (8) 12.64% 12.67% 11.80% 10.75% 9.60%
Tier 1 Capital (8) 13.68 14.06 13.55 12.91 11.67
Total Capital (8) 16.65 17.26 16.99 16.59 15.25
Leverage (6) 8.21 7.48 7.19 6.60 6.87
Citigroup common stockholders’ equity to assets 10.51% 10.00% 9.47% 8.52% 8.21%
Total Citigroup stockholders’ equity to assets 10.87 10.14 9.49 8.54 8.22
Dividend payout ratio (7) 0.9 1.6 0.8 NM NM
Book value per common share (3) $ 65.23 $ 61.57 $ 60.70 $ 56.15 $ 53.50
Ratio of earnings to fixed charges and preferred stock dividends 2.16x 1.37x 1.60x 1.51x NM
(1) Discontinued operations for 2009-2013 include the sale of Credicard. Discontinued operations in 2012 include a carve-out of Citi’s liquid strategies business within Citi Capital Advisors. Discontinued operations
in 2012 and 2011 reflect the sale of the Egg Banking credit card business. Discontinued operations for 2009 reflect the sale of Nikko Cordial Securities, Citi’s German retail banking operations and the sale of
CitiCapital’s equipment finance unit. Discontinued operations for 2009–2010 also include the sale of Citi’s Travelers Life & Annuity, substantially all of Citigroup’s international insurance business, and Citi’s Argentine
pension business. Discontinued operations for the second half of 2010 also reflect the sale of the Student Loan Corporation. See Note 2 to the Consolidated Financial Statements for additional information on Citi’s
discontinued operations.
(2) The diluted EPS calculation for 2009 utilizes basic shares and income allocated to unrestricted common stockholders (Basic) due to the negative income allocated to unrestricted common stockholders. Using diluted
shares and income allocated to unrestricted common stockholders (Diluted) would result in anti-dilution.
(3) All per share amounts and Citigroup shares outstanding for all periods reflect Citi’s 1-for-10 reverse stock split, which was effective May 6, 2011.
(4) The return on average common stockholders’ equity is calculated using net income less preferred stock dividends divided by average common stockholders’ equity. The return on average total Citigroup stockholders’
equity is calculated using net income divided by average Citigroup stockholders’ equity.
(5) As currently defined by the U.S. banking regulators, the Tier 1 Common ratio represents Tier 1 Capital less non-common elements, including qualifying perpetual preferred stock, qualifying noncontrolling interests in
subsidiaries and qualifying trust preferred securities divided by risk-weighted assets.
(6) The leverage ratio represents Tier 1 Capital divided by quarterly adjusted average total assets.
(7) Dividends declared per common share as a percentage of net income per diluted share.
(8) Effective January 1, 2013, computed under Basel I credit risk capital rules and final (revised) market risk capital rules (Basel II.5).
Note: The following accounting changes were adopted by Citi during the respective years:
• On January 1, 2010, Citi adopted ASC 810, Consolidation (formerly SFAS 166/167). Prior periods have not been restated as the standards were adopted prospectively.
• On January 1, 2009, Citi adopted SFAS No. 160, Noncontrolling Interests in Consolidated Financial Statements (now ASC 810-10-45-15, Consolidation: Noncontrolling Interest in a Subsidiary), and FSP EITF 03-6-1,
“Determining Whether Instruments Granted in Share-Based Payment Transactions are Participating Securities” (now ASC 260-10-45-59A, Earnings Per Share: Participating Securities and the Two-Class Method). All
prior periods have been restated to conform to the current period’s presentation.
Citigroup Inc. and Consolidated Subsidiaries