Citibank 2013 Annual Report Download - page 253
Download and view the complete annual report
Please find page 253 of the 2013 Citibank annual report below. You can navigate through the pages in the report by either clicking on the pages listed below, or by using the keyword search tool below to find specific information within the annual report.-
 1
1 -
2
-
3
-
4
-
5
-
6
-
7
-
8
-
9
-
10
-
11
-
12
-
13
-
14
-
15
-
16
-
17
-
18
-
19
-
20
-
21
-
22
-
23
-
24
-
25
-
26
-
27
-
28
-
29
-
30
-
31
-
32
-
33
-
34
-
35
-
36
-
37
-
38
-
39
-
40
-
41
-
42
-
43
-
44
-
45
-
46
-
47
-
48
-
49
-
50
-
51
-
52
-
53
-
54
-
55
-
56
-
57
-
58
-
59
-
60
-
61
-
62
-
63
-
64
-
65
-
66
-
67
-
68
-
69
-
70
-
71
-
72
-
73
-
74
-
75
-
76
-
77
-
78
-
79
-
80
-
81
-
82
-
83
-
84
-
85
-
86
-
87
-
88
-
89
-
90
-
91
-
92
-
93
-
94
-
95
-
96
-
97
-
98
-
99
-
100
-
101
-
102
-
103
-
104
-
105
-
106
-
107
-
108
-
109
-
110
-
111
-
112
-
113
-
114
-
115
-
116
-
117
-
118
-
119
-
120
-
121
-
122
-
123
-
124
-
125
-
126
-
127
-
128
-
129
-
130
-
131
-
132
-
133
-
134
-
135
-
136
-
137
-
138
-
139
-
140
-
141
-
142
-
143
-
144
-
145
-
146
-
147
-
148
-
149
-
150
-
151
-
152
-
153
-
154
-
155
-
156
-
157
-
158
-
159
-
160
-
161
-
162
-
163
-
164
-
165
-
166
-
167
-
168
-
169
-
170
-
171
-
172
-
173
-
174
-
175
-
176
-
177
-
178
-
179
-
180
-
181
-
182
-
183
-
184
-
185
-
186
-
187
-
188
-
189
-
190
-
191
-
192
-
193
-
194
-
195
-
196
-
197
-
198
-
199
-
200
-
201
-
202
-
203
-
204
-
205
-
206
-
207
-
208
-
209
-
210
-
211
-
212
-
213
-
214
-
215
-
216
-
217
-
218
-
219
-
220
-
221
-
222
-
223
-
224
-
225
-
226
-
227
-
228
-
229
-
230
-
231
-
232
-
233
-
234
-
235
-
236
-
237
-
238
-
239
-
240
-
241
-
242
-
 243
243 -
 244
244 -
 245
245 -
 246
246 -
 247
247 -
 248
248 -
 249
249 -
 250
250 -
 251
251 -
 252
252 -
 253
253 -
 254
254 -
 255
255 -
 256
256 -
 257
257 -
 258
258 -
 259
259 -
 260
260 -
 261
261 -
 262
262 -
 263
263 -
264
-
265
-
266
-
267
-
268
-
269
-
270
-
271
-
272
-
273
-
274
-
275
-
276
-
277
-
278
-
279
-
280
-
281
-
282
-
283
-
284
-
285
-
286
-
287
-
288
-
289
-
290
-
291
-
292
-
293
-
294
-
295
-
296
-
297
-
298
-
299
-
300
-
301
-
302
-
303
-
304
-
305
-
306
-
307
-
308
-
309
-
310
-
311
-
312
-
313
-
314
-
315
-
316
-
317
-
318
-
319
-
320
-
321
-
322
-
323
-
324
-
325
-
326
-
327
-
328
-
329
-
330
-
331
-
332
-
333
-
334
-
335
-
336
-
337
-
338
-
339
-
340
-
341
-
342
 |
 |

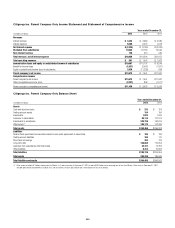
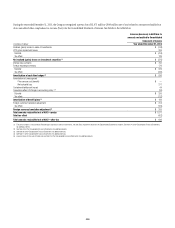
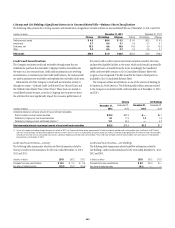
235
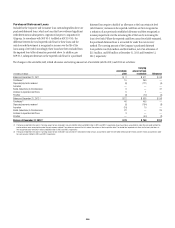
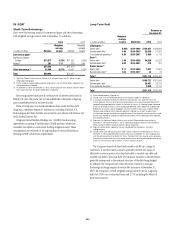
Citigroup Inc. Parent Company Only Income Statement and Statement of Comprehensive Income
Years ended December 31,
In millions of dollars 2013 2012 2011
Revenues
Interest revenue $ 3,234 $ 3,384 $ 3,684
Interest expense 5,559 6,573 7,618
Net interest expense $ (2,325) $ (3,189) $ (3,934)
Dividends from subsidiaries 13,044 20,780 13,046
Non-interest revenue 139 613 939
Total revenues, net of interest expense $10,858 $ 18,204 $10,051
Total operating expenses $ 851 $ 1,497 $ 1,503
Income before taxes and equity in undistributed income of subsidiaries $10,007 $ 16,707 $ 8,548
Benefit for income taxes (1,637) (2,062) (1,821)
Equity in undistributed income (loss) of subsidiaries 2,029 (11,228)698
Parent company’s net income $13,673 $ 7,541 $11,067
Comprehensive income
Parent company’s net income $13,673 $ 7,541 $11,067
Other comprehensive income (loss) (2,237) 892 (1,511)
Parent company’s comprehensive income $11,436 $ 8,433 $ 9,556
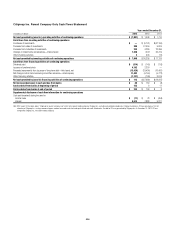
Citigroup Inc. Parent Company Only Balance Sheet
Years ended December 31,
In millions of dollars 2013 2012
Assets
Cash and due from banks $ 233 $ 153
Trading account assets 184 150
Investments 1,032 1,676
Advances to subsidiaries 83,110 107,074
Investments in subsidiaries 203,739 184,615
Other assets (1) 106,170 102,335
Total assets $394,468 $396,003
Liabilities
Federal funds purchased and securities loaned or sold under agreements to repurchase $ 185 $ 185
Trading account liabilities 165 170
Short-term borrowings 382 725
Long-term debt 156,804 176,553
Advances from subsidiaries other than banks 24,181 12,759
Other liabilities 8,412 16,562
Total liabilities $190,129 $206,954
Total equity 204,339 189,049
Total liabilities and equity $394,468 $396,003
(1) Other assets included $43.3 billion of placements to Citibank, N.A. and its branches at December 31, 2013, of which $33.6 billion had a remaining term of less than 30 days. Other assets at December 31, 2012
included $30.2 billion of placements to Citibank, N.A. and its branches, of which $28.2 billion had a remaining term of less than 30 days.