Citibank 2013 Annual Report Download - page 170
Download and view the complete annual report
Please find page 170 of the 2013 Citibank annual report below. You can navigate through the pages in the report by either clicking on the pages listed below, or by using the keyword search tool below to find specific information within the annual report.-
 1
1 -
2
-
3
-
4
-
5
-
6
-
7
-
8
-
9
-
10
-
11
-
12
-
13
-
14
-
15
-
16
-
17
-
18
-
19
-
20
-
21
-
22
-
23
-
24
-
25
-
26
-
27
-
28
-
29
-
30
-
31
-
32
-
33
-
34
-
35
-
36
-
37
-
38
-
39
-
40
-
41
-
42
-
43
-
44
-
45
-
46
-
47
-
48
-
49
-
50
-
51
-
52
-
53
-
54
-
55
-
56
-
57
-
58
-
59
-
60
-
61
-
62
-
63
-
64
-
65
-
66
-
67
-
68
-
69
-
70
-
71
-
72
-
73
-
74
-
75
-
76
-
77
-
78
-
79
-
80
-
81
-
82
-
83
-
84
-
85
-
86
-
87
-
88
-
89
-
90
-
91
-
92
-
93
-
94
-
95
-
96
-
97
-
98
-
99
-
100
-
101
-
102
-
103
-
104
-
105
-
106
-
107
-
108
-
109
-
110
-
111
-
112
-
113
-
114
-
115
-
116
-
117
-
118
-
119
-
120
-
121
-
122
-
123
-
124
-
125
-
126
-
127
-
128
-
129
-
130
-
131
-
132
-
133
-
134
-
135
-
136
-
137
-
138
-
139
-
140
-
141
-
142
-
143
-
144
-
145
-
146
-
147
-
148
-
149
-
150
-
151
-
152
-
153
-
154
-
155
-
156
-
157
-
158
-
159
-
 160
160 -
 161
161 -
 162
162 -
 163
163 -
 164
164 -
 165
165 -
 166
166 -
 167
167 -
 168
168 -
 169
169 -
 170
170 -
 171
171 -
 172
172 -
 173
173 -
 174
174 -
 175
175 -
 176
176 -
 177
177 -
 178
178 -
 179
179 -
 180
180 -
181
-
182
-
183
-
184
-
185
-
186
-
187
-
188
-
189
-
190
-
191
-
192
-
193
-
194
-
195
-
196
-
197
-
198
-
199
-
200
-
201
-
202
-
203
-
204
-
205
-
206
-
207
-
208
-
209
-
210
-
211
-
212
-
213
-
214
-
215
-
216
-
217
-
218
-
219
-
220
-
221
-
222
-
223
-
224
-
225
-
226
-
227
-
228
-
229
-
230
-
231
-
232
-
233
-
234
-
235
-
236
-
237
-
238
-
239
-
240
-
241
-
242
-
243
-
244
-
245
-
246
-
247
-
248
-
249
-
250
-
251
-
252
-
253
-
254
-
255
-
256
-
257
-
258
-
259
-
260
-
261
-
262
-
263
-
264
-
265
-
266
-
267
-
268
-
269
-
270
-
271
-
272
-
273
-
274
-
275
-
276
-
277
-
278
-
279
-
280
-
281
-
282
-
283
-
284
-
285
-
286
-
287
-
288
-
289
-
290
-
291
-
292
-
293
-
294
-
295
-
296
-
297
-
298
-
299
-
300
-
301
-
302
-
303
-
304
-
305
-
306
-
307
-
308
-
309
-
310
-
311
-
312
-
313
-
314
-
315
-
316
-
317
-
318
-
319
-
320
-
321
-
322
-
323
-
324
-
325
-
326
-
327
-
328
-
329
-
330
-
331
-
332
-
333
-
334
-
335
-
336
-
337
-
338
-
339
-
340
-
341
-
342
 |
 |

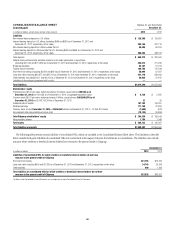
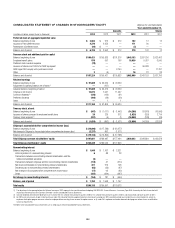
152
CONSOLIDATED STATEMENT OF CHANGES IN STOCKHOLDERS’ EQUITY Citigroup Inc. and Subsidiaries
Years ended December 31,
Amounts Shares
In millions of dollars, except shares in thousands 2013 2012 2011 2013 2012 2011
Preferred stock at aggregate liquidation value
Balance, beginning of year $ 2,562 $ 312 $ 312 102 12 12
Issuance of new preferred stock 4,270 2,250 — 171 90 —
Redemption of preferred stock (94) $ — — (3) — —
Balance, end of period $ 6,738 $ 2,562 $ 312 270 102 12
Common stock and additional paid-in capital
Balance, beginning of year $106,421 $105,833 $101,316 3,043,153 2,937,756 2,922,402
Employee benefit plans 878 597 766 18,930 9,037 3,540
Preferred stock issuance expense (78) — — —— —
Issuance of shares and T-DECs for TARP repayment —— — —96,338 —
ADIA Upper DECs equity units purchase contract —— 3,750 —— 11,781
Other 3(9) 1 16 22 33
Balance, end of period $107,224 $106,421 $105,833 3,062,099 3,043,153 2,937,756
Retained earnings
Balance, beginning of year $ 97,809 $ 90,520 $ 79,559
Adjustment to opening balance, net of taxes (1) —(107) —
Adjusted balance, beginning of period $ 97,809 $ 90,413 $ 79,559
Citigroup’s net income 13,673 7,541 11,067
Common dividends (2) (120) (120) (81)
Preferred dividends (194) (26) (26)
Other —1 1
Balance, end of period $111,168 $ 97,809 $ 90,520
Treasury stock, at cost
Balance, beginning of year $ (847) $ (1,071) $ (1,442) (14,269) (13,878) (16,566)
Issuance of shares pursuant to employee benefit plans 26 229 372 (1,629) (253) 2,714
Treasury stock acquired (3) (837) (5) (1) (16,958) (138) (26)
Balance, end of period $ (1,658) $ (847) $ (1,071) (32,856) (14,269) (13,878)
Citigroup’s accumulated other comprehensive income (loss)
Balance, beginning of year $ (16,896) $ (17,788) $ (16,277)
Net change in Citigroup’s Accumulated other comprehensive income (loss) (2,237) 892 (1,511)
Balance, end of period $ (19,133) $ (16,896) $ (17,788)
Total Citigroup common stockholders’ equity $197,601 $186,487 $177,494 3,029,243 3,028,884 2,923,878
Total Citigroup stockholders’ equity $204,339 $189,049 $177,806
Noncontrolling interest
Balance, beginning of year $ 1,948 $ 1,767 $ 2,321
Initial origination of a noncontrolling interest 688 28
Transactions between noncontrolling-interest shareholders and the
related consolidated subsidiary (2) — —
Transactions between Citigroup and the noncontrolling-interest shareholders (118) 41 (274)
Net income attributable to noncontrolling-interest shareholders 227 219 148
Dividends paid to noncontrolling-interest shareholders (63) (33) (67)
Net change in Accumulated other comprehensive income (loss) (17) 90 (92)
Other (187) (224) (297)
Net change in noncontrolling interests $ (154) $ 181 $ (554)
Balance, end of period $ 1,794 $ 1,948 $ 1,767
Total equity $206,133 $190,997 $179,573
(1) The adjustment to the opening balance for Retained earnings in 2012 represents the cumulative effect of adopting ASU 2010-26, Financial Services—Insurance (Topic 944): Accounting for Costs Associated with
Acquiring or Renewing Insurance Contracts. See Note 1 to the Consolidated Financial Statements.
(2) Common dividends declared were $0.01 per share in each of the first, second, third and fourth quarters of 2013, first, second, third and fourth quarters of 2012, and second, third and fourth quarters of 2011.
(3) For 2013, primarily consists of open market purchases under Citi’s Board of Directors-approved common stock repurchase program. 2013 and other periods also include treasury stock related to (i) activity on
employee stock option program exercises where the employee delivers existing shares to cover the option exercise, or (ii) under Citi’s employee restricted or deferred stock programs where shares are withheld to
satisfy tax requirements.
The Notes to the Consolidated Financial Statements are an integral part of these Consolidated Financial Statements.