Citibank 2013 Annual Report Download - page 25
Download and view the complete annual report
Please find page 25 of the 2013 Citibank annual report below. You can navigate through the pages in the report by either clicking on the pages listed below, or by using the keyword search tool below to find specific information within the annual report.-
 1
1 -
2
-
3
-
4
-
5
-
6
-
7
-
8
-
9
-
10
-
11
-
12
-
13
-
14
-
 15
15 -
 16
16 -
 17
17 -
 18
18 -
 19
19 -
 20
20 -
 21
21 -
 22
22 -
 23
23 -
 24
24 -
 25
25 -
 26
26 -
 27
27 -
 28
28 -
 29
29 -
 30
30 -
 31
31 -
 32
32 -
 33
33 -
 34
34 -
 35
35 -
36
-
37
-
38
-
39
-
40
-
41
-
42
-
43
-
44
-
45
-
46
-
47
-
48
-
49
-
50
-
51
-
52
-
53
-
54
-
55
-
56
-
57
-
58
-
59
-
60
-
61
-
62
-
63
-
64
-
65
-
66
-
67
-
68
-
69
-
70
-
71
-
72
-
73
-
74
-
75
-
76
-
77
-
78
-
79
-
80
-
81
-
82
-
83
-
84
-
85
-
86
-
87
-
88
-
89
-
90
-
91
-
92
-
93
-
94
-
95
-
96
-
97
-
98
-
99
-
100
-
101
-
102
-
103
-
104
-
105
-
106
-
107
-
108
-
109
-
110
-
111
-
112
-
113
-
114
-
115
-
116
-
117
-
118
-
119
-
120
-
121
-
122
-
123
-
124
-
125
-
126
-
127
-
128
-
129
-
130
-
131
-
132
-
133
-
134
-
135
-
136
-
137
-
138
-
139
-
140
-
141
-
142
-
143
-
144
-
145
-
146
-
147
-
148
-
149
-
150
-
151
-
152
-
153
-
154
-
155
-
156
-
157
-
158
-
159
-
160
-
161
-
162
-
163
-
164
-
165
-
166
-
167
-
168
-
169
-
170
-
171
-
172
-
173
-
174
-
175
-
176
-
177
-
178
-
179
-
180
-
181
-
182
-
183
-
184
-
185
-
186
-
187
-
188
-
189
-
190
-
191
-
192
-
193
-
194
-
195
-
196
-
197
-
198
-
199
-
200
-
201
-
202
-
203
-
204
-
205
-
206
-
207
-
208
-
209
-
210
-
211
-
212
-
213
-
214
-
215
-
216
-
217
-
218
-
219
-
220
-
221
-
222
-
223
-
224
-
225
-
226
-
227
-
228
-
229
-
230
-
231
-
232
-
233
-
234
-
235
-
236
-
237
-
238
-
239
-
240
-
241
-
242
-
243
-
244
-
245
-
246
-
247
-
248
-
249
-
250
-
251
-
252
-
253
-
254
-
255
-
256
-
257
-
258
-
259
-
260
-
261
-
262
-
263
-
264
-
265
-
266
-
267
-
268
-
269
-
270
-
271
-
272
-
273
-
274
-
275
-
276
-
277
-
278
-
279
-
280
-
281
-
282
-
283
-
284
-
285
-
286
-
287
-
288
-
289
-
290
-
291
-
292
-
293
-
294
-
295
-
296
-
297
-
298
-
299
-
300
-
301
-
302
-
303
-
304
-
305
-
306
-
307
-
308
-
309
-
310
-
311
-
312
-
313
-
314
-
315
-
316
-
317
-
318
-
319
-
320
-
321
-
322
-
323
-
324
-
325
-
326
-
327
-
328
-
329
-
330
-
331
-
332
-
333
-
334
-
335
-
336
-
337
-
338
-
339
-
340
-
341
-
342
 |
 |
7
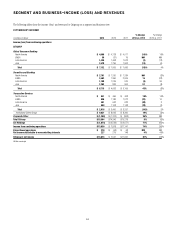
Citicorp were broadly unchanged. Net interest revenues of $46.8 billion
were unchanged versus the prior year, largely driven by continued spread
compression in Transaction Services in Citicorp, offset by improvements in
Citi Holdings, principally reflecting lower funding costs. Excluding CVA/DVA
and the impact of minority investments in 2012, non-interest revenues of
$29.9 billion were up 2% from the prior year, principally driven by higher
revenues in Securities and Banking, Latin America Regional Consumer
Banking (RCB) and Transaction Services in Citicorp, as well as the
absence of repurchase reserve builds for representation and warranty claims
in Citi Holdings. The increase was partially offset by a decline in mortgage
origination revenues, due to significantly lower U.S. mortgage refinancing
activity in North America RCB, particularly in the second half of 2013.
Operating Expenses
Citigroup expenses decreased 3% versus the prior year to $48.4 billion.
In 2013, Citi incurred legal and related costs of $3.0 billion, compared
to $2.8 billion in the prior year. Excluding legal and related costs, the
repositioning charges in the fourth quarter of 2012 and the impact of
foreign exchange translation into U.S. dollars for reporting purposes (FX
translation), which lowered reported expenses by approximately $600 million
in 2013 compared to 2012, operating expenses remained relatively
unchanged at $45.4 billion compared to $45.5 billion in the prior year.
(Citi’s results of operations excluding the impact of FX translation are non-
GAAP financial measures. Citigroup believes the presentation of its results
of operations excluding the impact of FX translation is a more meaningful
depiction of the underlying fundamentals of its businesses impacted by
FX translation.)
Citicorp’s expenses were $42.5 billion, down 5% from the prior year,
primarily reflecting efficiency savings and lower legal and related costs
and repositioning charges, partially offset by volume-related expenses
and ongoing investments in the businesses. In addition, as disclosed on
February 28, 2014. Citicorp’s expenses in the fourth quarter of 2013 were
impacted as a result of a fraud discovered in Banco Nacional de Mexico
(Banamex), a Citi subsidiary in Mexico. The fraud increased fourth quarter
of 2013 operating expenses in Transaction Services by an estimated
$400 million, with an offset to compensation expense of approximately
$40 million associated with the Banamex variable compensation plan.
For further information, see “Institutional Clients Group—Transaction
Services” below and Note 29 to the Consolidated Financial Statements.
Citi Holdings expenses increased 13% year-over-year to $5.9 billion,
primarily due to higher legal and related expenses, partially offset by the
continued decline in assets and the resulting decline in operating expenses.
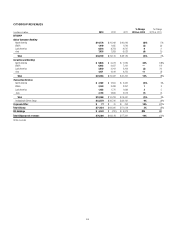
Credit Costs and Allowance for Loan Losses
Citi’s total provisions for credit losses and for benefits and claims of
$8.5 billion declined 25% from the prior year. Net credit losses of $10.5 billion
were down 26% from 2012. Consumer net credit losses declined 27% to
$10.3 billion, reflecting improvements in the North America mortgage
portfolio within Citi Holdings, as well as North America Citi-branded cards
and Citi retail services portfolios in Citicorp. Corporate net credit losses
decreased 10% year-over-year to $201 million, driven primarily by continued
credit improvement in Securities and Banking in Citicorp.
The net release of allowance for loan losses and unfunded lending
commitments was $2.8 billion in 2013, 27% lower than 2012. Citicorp’s
net reserve release declined 66% to $736 million, primarily due to a lower
reserve release in North America Citi-branded cards and Citi retail services
and volume-related loan loss reserve builds in international Global
Consumer Banking (GCB). Citi Holdings net reserve release increased
27% to $2.0 billion, substantially all of which related to the North America
mortgage portfolio. $2.6 billion of the $2.8 billion net reserve release related
to Consumer lending, with the remainder applicable to Corporate.
Citigroup’s total allowance for loan losses was $19.6 billion at year-end
2013, or 2.98% of total loans, compared to $25.5 billion, or 3.92%, at the
end of the prior year. The decline in the total allowance for loan losses
reflected the continued wind down of Citi Holdings and overall continued
improvement in the credit quality of the loan portfolios.
The Consumer allowance for loan losses was $17.1 billion, or 4.35% of
total Consumer loans, at year-end 2013, compared to $22.7 billion, or 5.57%
of total loans, at year-end 2012. Total non-accrual assets fell to $9.4 billion,
a 22% reduction compared to year-end 2012. Corporate non-accrual loans
declined 18% to $1.9 billion, while Consumer non-accrual loans declined
23% to $7.0 billion, both reflecting continued credit improvement.
Capital
Citigroup’s Tier 1 Capital and Tier 1 Common ratios were 13.7% and 12.6%
as of December 31, 2013, respectively, compared to 14.1% and 12.7% as
of December 31, 2012. Citi’s estimated Tier 1 Common ratio under Basel
III was 10.6% at year-end 2013, up from an estimated 8.7% at year-end
2012. Citigroup’s estimated Basel III Supplementary Leverage ratio for
the fourth quarter 2013 was 5.4%. (For additional information on Citi’s
estimated Basel III Tier 1 Common ratio, Supplementary Leverage ratio and
related components, see “Risk Factors—Regulatory Risks” and “Capital
Resources” below.)