Citibank 2013 Annual Report Download - page 44
Download and view the complete annual report
Please find page 44 of the 2013 Citibank annual report below. You can navigate through the pages in the report by either clicking on the pages listed below, or by using the keyword search tool below to find specific information within the annual report.-
 1
1 -
2
-
3
-
4
-
5
-
6
-
7
-
8
-
9
-
10
-
11
-
12
-
13
-
14
-
15
-
16
-
17
-
18
-
19
-
20
-
21
-
22
-
23
-
24
-
25
-
26
-
27
-
28
-
29
-
30
-
31
-
32
-
33
-
 34
34 -
 35
35 -
 36
36 -
 37
37 -
 38
38 -
 39
39 -
 40
40 -
 41
41 -
 42
42 -
 43
43 -
 44
44 -
 45
45 -
 46
46 -
 47
47 -
 48
48 -
 49
49 -
 50
50 -
 51
51 -
 52
52 -
 53
53 -
 54
54 -
55
-
56
-
57
-
58
-
59
-
60
-
61
-
62
-
63
-
64
-
65
-
66
-
67
-
68
-
69
-
70
-
71
-
72
-
73
-
74
-
75
-
76
-
77
-
78
-
79
-
80
-
81
-
82
-
83
-
84
-
85
-
86
-
87
-
88
-
89
-
90
-
91
-
92
-
93
-
94
-
95
-
96
-
97
-
98
-
99
-
100
-
101
-
102
-
103
-
104
-
105
-
106
-
107
-
108
-
109
-
110
-
111
-
112
-
113
-
114
-
115
-
116
-
117
-
118
-
119
-
120
-
121
-
122
-
123
-
124
-
125
-
126
-
127
-
128
-
129
-
130
-
131
-
132
-
133
-
134
-
135
-
136
-
137
-
138
-
139
-
140
-
141
-
142
-
143
-
144
-
145
-
146
-
147
-
148
-
149
-
150
-
151
-
152
-
153
-
154
-
155
-
156
-
157
-
158
-
159
-
160
-
161
-
162
-
163
-
164
-
165
-
166
-
167
-
168
-
169
-
170
-
171
-
172
-
173
-
174
-
175
-
176
-
177
-
178
-
179
-
180
-
181
-
182
-
183
-
184
-
185
-
186
-
187
-
188
-
189
-
190
-
191
-
192
-
193
-
194
-
195
-
196
-
197
-
198
-
199
-
200
-
201
-
202
-
203
-
204
-
205
-
206
-
207
-
208
-
209
-
210
-
211
-
212
-
213
-
214
-
215
-
216
-
217
-
218
-
219
-
220
-
221
-
222
-
223
-
224
-
225
-
226
-
227
-
228
-
229
-
230
-
231
-
232
-
233
-
234
-
235
-
236
-
237
-
238
-
239
-
240
-
241
-
242
-
243
-
244
-
245
-
246
-
247
-
248
-
249
-
250
-
251
-
252
-
253
-
254
-
255
-
256
-
257
-
258
-
259
-
260
-
261
-
262
-
263
-
264
-
265
-
266
-
267
-
268
-
269
-
270
-
271
-
272
-
273
-
274
-
275
-
276
-
277
-
278
-
279
-
280
-
281
-
282
-
283
-
284
-
285
-
286
-
287
-
288
-
289
-
290
-
291
-
292
-
293
-
294
-
295
-
296
-
297
-
298
-
299
-
300
-
301
-
302
-
303
-
304
-
305
-
306
-
307
-
308
-
309
-
310
-
311
-
312
-
313
-
314
-
315
-
316
-
317
-
318
-
319
-
320
-
321
-
322
-
323
-
324
-
325
-
326
-
327
-
328
-
329
-
330
-
331
-
332
-
333
-
334
-
335
-
336
-
337
-
338
-
339
-
340
-
341
-
342
 |
 |

26
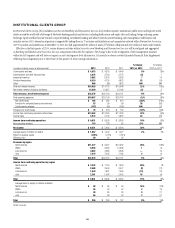
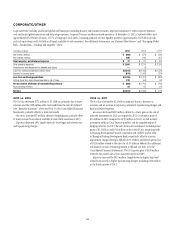
INSTITUTIONAL CLIENTS GROUP
Institutional Clients Group (ICG) includes Securities and Banking and Transaction Services. ICG provides corporate, institutional, public sector and high-net-worth
clients around the world with a full range of wholesale banking products and services, including fixed income and equity sales and trading, foreign exchange, prime
brokerage, equity and fixed income research, corporate lending, investment banking and advisory services, private banking, cash management, trade finance and
securities services. ICG’s international presence is supported by trading floors in 75 countries and jurisdictions and a proprietary network within Transaction Services in
over 95 countries and jurisdictions. At December 31, 2013, ICG had approximately $1 trillion of assets, $574 billion of deposits and $14.3 trillion of assets under custody.
Effective in the first quarter of 2014, certain business activities within Securities and Banking and Transaction Services will be realigned and aggregated
as Banking and Markets and Securities Services components within the ICG segment. The change is due to the realignment of the management structure
within the ICG segment and will have no impact on any total segment-level information. Citi intends to release a revised Quarterly Financial Data Supplement
reflecting this realignment prior to the release of first quarter of 2014 earnings information.
In millions of dollars, except as otherwise noted 2013 2012 2011
% Change
2013 vs. 2012
% Change
2012 vs. 2011
Commissions and fees $ 4,515 $ 4,318 $ 4,449 5% (3)%
Administration and other fiduciary fees 2,675 2,790 2,775 (4)1
Investment banking 3,862 3,618 3,029 719
Principal transactions 6,310 4,130 4,873 53 (15)
Other 666 (83) 1,822 NM NM
Total non-interest revenue $18,028 $ 14,773 $ 16,948 22% (13)%
Net interest revenue (including dividends) 15,550 15,957 15,183 (3)5
Total revenues, net of interest expense $33,578 $ 30,730 $ 32,131 9% (4)%
Total operating expenses $19,897 $ 20,199 $ 20,747 (1)% (3)%
Net credit losses $ 182 $ 282 $ 619 (35)% (54)%
Provision for unfunded lending commitments 53 39 89 36 (56)
Credit reserve (release) (157) (45) (556) NM 92
Provisions for credit losses $ 78 $ 276 $ 152 (72)% 82%
Income from continuing operations before taxes $13,603 $ 10,255 $ 11,232 33% (9)%
Income taxes 3,972 2,162 2,872 84 (25)
Income from continuing operations $ 9,631 $ 8,093 $ 8,360 19% (3)%
Noncontrolling interests 110 128 56 (14)NM
Net income $ 9,521 $ 7,965 $ 8,304 20% (4)%
Average assets (in billions of dollars) $ 1,067 $ 1,044 $ 1,027 2% 2%
Return on average assets 0.89% 0.76% 0.81%
Efficiency ratio 59 66 65
Revenues by region
North America $11,547 $ 9,027 $ 10,362 28% (13)%
EMEA 9,995 9,925 10,638 1(7)
Latin America 4,662 4,683 3,948 —19
Asia 7,374 7,095 7,183 4(1)
Total $33,578 $ 30,730 $ 32,131 9% (4)%
Income from continuing operations by region
North America $ 3,242 $ 1,716 $ 1,692 89% 1%
EMEA 2,488 2,544 3,077 (2) (17)
Latin America 1,640 1,891 1,539 (13)23
Asia 2,261 1,942 2,052 16 (5)
Total $ 9,631 $ 8,093 $ 8,360 19% (3)%
Average loans by region (in billions of dollars)
North America $ 98 $ 83 $ 69 18% 20%
EMEA 55 53 47 413
Latin America 38 35 29 921
Asia 65 63 52 321
Total $ 256 $ 234 $ 197 9% 19%
NM Not meaningful