Citibank 2013 Annual Report Download - page 307
Download and view the complete annual report
Please find page 307 of the 2013 Citibank annual report below. You can navigate through the pages in the report by either clicking on the pages listed below, or by using the keyword search tool below to find specific information within the annual report.-
 1
1 -
2
-
3
-
4
-
5
-
6
-
7
-
8
-
9
-
10
-
11
-
12
-
13
-
14
-
15
-
16
-
17
-
18
-
19
-
20
-
21
-
22
-
23
-
24
-
25
-
26
-
27
-
28
-
29
-
30
-
31
-
32
-
33
-
34
-
35
-
36
-
37
-
38
-
39
-
40
-
41
-
42
-
43
-
44
-
45
-
46
-
47
-
48
-
49
-
50
-
51
-
52
-
53
-
54
-
55
-
56
-
57
-
58
-
59
-
60
-
61
-
62
-
63
-
64
-
65
-
66
-
67
-
68
-
69
-
70
-
71
-
72
-
73
-
74
-
75
-
76
-
77
-
78
-
79
-
80
-
81
-
82
-
83
-
84
-
85
-
86
-
87
-
88
-
89
-
90
-
91
-
92
-
93
-
94
-
95
-
96
-
97
-
98
-
99
-
100
-
101
-
102
-
103
-
104
-
105
-
106
-
107
-
108
-
109
-
110
-
111
-
112
-
113
-
114
-
115
-
116
-
117
-
118
-
119
-
120
-
121
-
122
-
123
-
124
-
125
-
126
-
127
-
128
-
129
-
130
-
131
-
132
-
133
-
134
-
135
-
136
-
137
-
138
-
139
-
140
-
141
-
142
-
143
-
144
-
145
-
146
-
147
-
148
-
149
-
150
-
151
-
152
-
153
-
154
-
155
-
156
-
157
-
158
-
159
-
160
-
161
-
162
-
163
-
164
-
165
-
166
-
167
-
168
-
169
-
170
-
171
-
172
-
173
-
174
-
175
-
176
-
177
-
178
-
179
-
180
-
181
-
182
-
183
-
184
-
185
-
186
-
187
-
188
-
189
-
190
-
191
-
192
-
193
-
194
-
195
-
196
-
197
-
198
-
199
-
200
-
201
-
202
-
203
-
204
-
205
-
206
-
207
-
208
-
209
-
210
-
211
-
212
-
213
-
214
-
215
-
216
-
217
-
218
-
219
-
220
-
221
-
222
-
223
-
224
-
225
-
226
-
227
-
228
-
229
-
230
-
231
-
232
-
233
-
234
-
235
-
236
-
237
-
238
-
239
-
240
-
241
-
242
-
243
-
244
-
245
-
246
-
247
-
248
-
249
-
250
-
251
-
252
-
253
-
254
-
255
-
256
-
257
-
258
-
259
-
260
-
261
-
262
-
263
-
264
-
265
-
266
-
267
-
268
-
269
-
270
-
271
-
272
-
273
-
274
-
275
-
276
-
277
-
278
-
279
-
280
-
281
-
282
-
283
-
284
-
285
-
286
-
287
-
288
-
289
-
290
-
291
-
292
-
293
-
294
-
295
-
296
-
 297
297 -
 298
298 -
 299
299 -
 300
300 -
 301
301 -
 302
302 -
 303
303 -
 304
304 -
 305
305 -
 306
306 -
 307
307 -
 308
308 -
 309
309 -
 310
310 -
 311
311 -
 312
312 -
 313
313 -
 314
314 -
 315
315 -
 316
316 -
 317
317 -
318
-
319
-
320
-
321
-
322
-
323
-
324
-
325
-
326
-
327
-
328
-
329
-
330
-
331
-
332
-
333
-
334
-
335
-
336
-
337
-
338
-
339
-
340
-
341
-
342
 |
 |
289
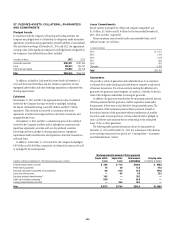
Items Measured at Fair Value on a Nonrecurring Basis
Certain assets and liabilities are measured at fair value on a nonrecurring
basis and therefore are not included in the tables above. These include assets
measured at cost that have been written down to fair value during the periods
as a result of an impairment. In addition, these assets include loans held-
for-sale and other real estate owned that are measured at the lower of cost
or market.
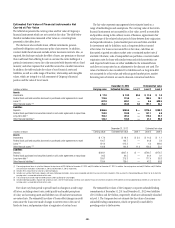
The following table presents the carrying amounts of all assets that were
still held as of December 31, 2013 and December 31, 2012, and for which a
nonrecurring fair value measurement was recorded during the six and twelve
months then ended, respectively:
In millions of dollars Fair value Level 2 Level 3
December 31, 2013
Loans held-for-sale $3,483 $ 2,165 $ 1,318
Other real estate owned 138 15 123
Loans (1) 4,713 3,947 766
Total assets at fair value on a
nonrecurring basis $8,334 $ 6,127 $ 2,207
(1) Represents impaired loans held for investment whose carrying amount is based on the fair value of
the underlying collateral, including primarily real-estate secured loans.
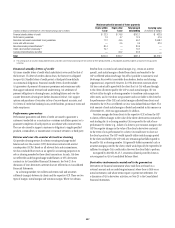
In millions of dollars Fair value Level 2 Level 3
December 31, 2012
Loans held-for-sale $ 2,647 $ 1,159 $ 1,488
Other real estate owned 201 22 179
Loans (1) 5,732 5,160 572
Other assets (2) 4,725 4,725 —
Total assets at fair value on a
nonrecurring basis $13,305 $11,066 $ 2,239
(1) Represents impaired loans held for investment whose carrying amount is based on the fair value of
the underlying collateral, including primarily real-estate secured loans.
(2) Represents Citi’s then-remaining 35% investment in the Morgan Stanley Smith Barney joint
venture whose carrying amount was the agreed purchase price. See Note 14 to the Consolidated
Financial Statements.
The fair value of loans-held-for-sale is determined where possible using
quoted secondary-market prices. If no such quoted price exists, the fair value
of a loan is determined using quoted prices for a similar asset or assets,
adjusted for the specific attributes of that loan. Fair value for the other real
estate owned is based on appraisals. For loans whose carrying amount is
based on the fair value of the underlying collateral, the fair values depend
on the type of collateral. Fair value of the collateral is typically estimated
based on quoted market prices if available, appraisals or other internal
valuation techniques.
Where the fair value of the related collateral is based on an unadjusted
appraised value, the loan is generally classified as Level 2. Where significant
adjustments are made to the appraised value, the loan is classified as Level 3.
Additionally, for corporate loans, appraisals of the collateral are often based
on sales of similar assets; however, because the prices of similar assets require
significant adjustments to reflect the unique features of the underlying
collateral, these fair value measurements are generally classified as Level 3.
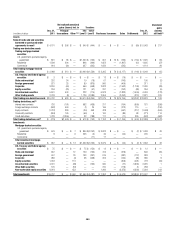
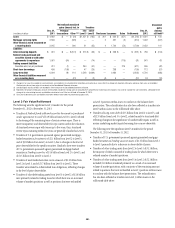
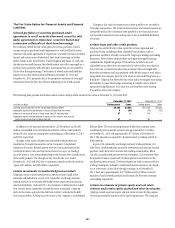
Valuation Techniques and Inputs for Level 3 Nonrecurring Fair Value Measurements
The following tables present the valuation techniques covering the majority of Level 3 nonrecurring fair value measurements and the most significant
unobservable inputs used in those measurements as of December 31, 2013 and December 31, 2012:
Fair Value (1) Weighted
average
As of December 31, 2013 (in millions) Methodology Input Low High (2)
Loans held-for-sale $912 Price-based Price $ 60.00 $ 100.00 $ 98.77
393 Cash flow Credit spread 45 bps 80 bps 64 bps
Other real estate owned $ 98 Price-based Discount to price 24.00% 59.00% 32.22%
17 Cash flow Price $ 60.46 $ 100.00 $ 96.67
Appraised value $ 636,249 $15,897,503 $11,392,478
Loans (3) $581 Price-based Discount to price 24.00% 34.00% 26.48%
109 Model-based Price $ 52.40 $ 68.39 $ 65.32
Appraised value $6,500,000 $86,000,000 $43,532,719
(1) The fair value amounts presented in this table represent the primary valuation technique or techniques for each class of assets or liabilities.
(2) Weighted averages are calculated based on the fair value of the instrument.
(3) Represents loans held for investment whose carrying amounts are based on the fair value of the underlying collateral.