Citibank 2013 Annual Report Download - page 140
Download and view the complete annual report
Please find page 140 of the 2013 Citibank annual report below. You can navigate through the pages in the report by either clicking on the pages listed below, or by using the keyword search tool below to find specific information within the annual report.-
 1
1 -
2
-
3
-
4
-
5
-
6
-
7
-
8
-
9
-
10
-
11
-
12
-
13
-
14
-
15
-
16
-
17
-
18
-
19
-
20
-
21
-
22
-
23
-
24
-
25
-
26
-
27
-
28
-
29
-
30
-
31
-
32
-
33
-
34
-
35
-
36
-
37
-
38
-
39
-
40
-
41
-
42
-
43
-
44
-
45
-
46
-
47
-
48
-
49
-
50
-
51
-
52
-
53
-
54
-
55
-
56
-
57
-
58
-
59
-
60
-
61
-
62
-
63
-
64
-
65
-
66
-
67
-
68
-
69
-
70
-
71
-
72
-
73
-
74
-
75
-
76
-
77
-
78
-
79
-
80
-
81
-
82
-
83
-
84
-
85
-
86
-
87
-
88
-
89
-
90
-
91
-
92
-
93
-
94
-
95
-
96
-
97
-
98
-
99
-
100
-
101
-
102
-
103
-
104
-
105
-
106
-
107
-
108
-
109
-
110
-
111
-
112
-
113
-
114
-
115
-
116
-
117
-
118
-
119
-
120
-
121
-
122
-
123
-
124
-
125
-
126
-
127
-
128
-
129
-
 130
130 -
 131
131 -
 132
132 -
 133
133 -
 134
134 -
 135
135 -
 136
136 -
 137
137 -
 138
138 -
 139
139 -
 140
140 -
 141
141 -
 142
142 -
 143
143 -
 144
144 -
 145
145 -
 146
146 -
 147
147 -
 148
148 -
 149
149 -
 150
150 -
151
-
152
-
153
-
154
-
155
-
156
-
157
-
158
-
159
-
160
-
161
-
162
-
163
-
164
-
165
-
166
-
167
-
168
-
169
-
170
-
171
-
172
-
173
-
174
-
175
-
176
-
177
-
178
-
179
-
180
-
181
-
182
-
183
-
184
-
185
-
186
-
187
-
188
-
189
-
190
-
191
-
192
-
193
-
194
-
195
-
196
-
197
-
198
-
199
-
200
-
201
-
202
-
203
-
204
-
205
-
206
-
207
-
208
-
209
-
210
-
211
-
212
-
213
-
214
-
215
-
216
-
217
-
218
-
219
-
220
-
221
-
222
-
223
-
224
-
225
-
226
-
227
-
228
-
229
-
230
-
231
-
232
-
233
-
234
-
235
-
236
-
237
-
238
-
239
-
240
-
241
-
242
-
243
-
244
-
245
-
246
-
247
-
248
-
249
-
250
-
251
-
252
-
253
-
254
-
255
-
256
-
257
-
258
-
259
-
260
-
261
-
262
-
263
-
264
-
265
-
266
-
267
-
268
-
269
-
270
-
271
-
272
-
273
-
274
-
275
-
276
-
277
-
278
-
279
-
280
-
281
-
282
-
283
-
284
-
285
-
286
-
287
-
288
-
289
-
290
-
291
-
292
-
293
-
294
-
295
-
296
-
297
-
298
-
299
-
300
-
301
-
302
-
303
-
304
-
305
-
306
-
307
-
308
-
309
-
310
-
311
-
312
-
313
-
314
-
315
-
316
-
317
-
318
-
319
-
320
-
321
-
322
-
323
-
324
-
325
-
326
-
327
-
328
-
329
-
330
-
331
-
332
-
333
-
334
-
335
-
336
-
337
-
338
-
339
-
340
-
341
-
342
 |
 |

122
Emerging Markets Trading Account Assets and Investment Securities
In the ordinary course of business, Citi holds securities in its trading accounts
and investment accounts, including those above. Trading account assets are
marked to market daily, with asset levels varying as Citi maintains inventory
consistent with customer needs. Investment securities are recorded at either
fair value or historical cost, based on the underlying accounting treatment,
and are predominantly held as part of the local entity asset and liability
management program, or to comply with local regulatory requirements.
In the markets in the table above, 98% of Citi’s investment securities were
related to sovereign issuers.
Emerging Markets Consumer Lending
GCB’s strategy within the emerging markets is consistent with GCB’s
overall strategy, which is to leverage its global footprint and seek to be the
preeminent bank for the emerging affluent and affluent consumers in
large urban centers. In credit cards and in certain retail markets, Citi serves
customers in a somewhat broader set of segments and geographies. Overall,
Citi believes that its customers are more resilient than the overall market
under a wide range of economic conditions. Citi’s Consumer business has
a well-established risk appetite framework across geographies and products
that reflects the business strategy and activities and establishes boundaries
around the key risks that arise from the strategy and activities.
As of December 31, 2013, GCB had approximately $127 billion of
Consumer loans outstanding to borrowers in the emerging markets, or
approximately 42% of GCB’s total loans, compared to approximately
$118 billion or 41% of total GCB loans as of December 31, 2012. Of the
approximately $127 billion as of December 31, 2013, the five largest
emergingmarkets—Mexico,Korea,Singapore,HongKongandIndia—
comprised approximately 28% of GCB’s total loans.
Within the emerging markets, 28% of Citi’s GCB loans were mortgages,
27% were commercial markets loans, 23% were personal loans, and 22% were
credit cards loans, each as of year-end 2013.
Overall consumer credit quality in the emerging markets remained
generally stable in 2013, as net credit losses were 1.9% of average loans in
2013, compared to 1.8% in 2012, consistent with Citi’s target market strategy
and risk appetite framework.
Emerging Markets Corporate Lending
Consistent with its overall strategy, Citi’s Corporate clients in the emerging
markets are typically large, multi-national corporations who value Citi’s
global network. Citi aims to establish relationships with these clients that
encompass multiple products, consistent with client needs, including
cash management and trade services, foreign exchange, lending,
capital markets and M&A advisory. Citi believes that its target corporate
segment is more resilient under a wide range of economic conditions,
and that its relationship-based approach to client service enables it to
effectively manage the risks inherent in such relationships. Citi has a
well-established risk appetite framework around its corporate lending
activities, including risk-based limits and approval authorities and portfolio
concentration boundaries.
As of December 31, 2013, ICG had approximately $126 billion of
loans outstanding to borrowers in the emerging markets, representing
approximately 47% of ICG’s total loans outstanding, as compared to
approximately $117 billion or 48% of ICG loans outstanding at December 31,
2012. No single emerging market country accounted for more than 6% of
Citi’s ICG loans as of December 31, 2013.
As of December 31, 2013, approximately two-thirds of Citi’s emerging
markets Corporate loans (excluding Private Bank in Securities and
Banking) are to borrowers whose ultimate parent is rated investment grade,
which Citi considers to be ratings of BBB or better according to Citi’s internal
risk measurement system and methodology (for additional information on
Citi’s internal risk measurement system for Corporate loans, see “Corporate
Credit Details” above). The vast majority of the remainder are rated BB or B
according to Citi’s internal risk measurement system and methodology.
Overall ICG net credit losses in the emerging markets were 0.04% of
average loans in 2013, as compared to 0.2% in 2012. The ratio of non-
accrual ICG loans to total loans in the emerging markets remained stable at
0.5% as of December 31, 2013, as compared with December 31, 2012.
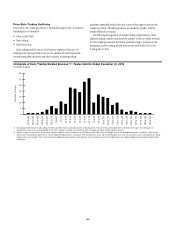
The following chart shows the composition of emerging markets ICG
loans overall and for Citi’s three largest ICG lending markets—Brazil, China
and India—by type of loan.
IndiaChinaBrazilTotal Emerging
Markets
43%
39%
18%
59%
29%
13%
47%
39%
13%
60%
37%
3%
$125.8 $14.4 $10.3
$12.1
Funded Emerging Markets ICG Loans by Loan Type
In billions of dollars
Transaction Services Corporate Lending in S&B Private Bank and Other