Citibank 2013 Annual Report Download - page 26
Download and view the complete annual report
Please find page 26 of the 2013 Citibank annual report below. You can navigate through the pages in the report by either clicking on the pages listed below, or by using the keyword search tool below to find specific information within the annual report.-
 1
1 -
2
-
3
-
4
-
5
-
6
-
7
-
8
-
9
-
10
-
11
-
12
-
13
-
14
-
15
-
 16
16 -
 17
17 -
 18
18 -
 19
19 -
 20
20 -
 21
21 -
 22
22 -
 23
23 -
 24
24 -
 25
25 -
 26
26 -
 27
27 -
 28
28 -
 29
29 -
 30
30 -
 31
31 -
 32
32 -
 33
33 -
 34
34 -
 35
35 -
 36
36 -
37
-
38
-
39
-
40
-
41
-
42
-
43
-
44
-
45
-
46
-
47
-
48
-
49
-
50
-
51
-
52
-
53
-
54
-
55
-
56
-
57
-
58
-
59
-
60
-
61
-
62
-
63
-
64
-
65
-
66
-
67
-
68
-
69
-
70
-
71
-
72
-
73
-
74
-
75
-
76
-
77
-
78
-
79
-
80
-
81
-
82
-
83
-
84
-
85
-
86
-
87
-
88
-
89
-
90
-
91
-
92
-
93
-
94
-
95
-
96
-
97
-
98
-
99
-
100
-
101
-
102
-
103
-
104
-
105
-
106
-
107
-
108
-
109
-
110
-
111
-
112
-
113
-
114
-
115
-
116
-
117
-
118
-
119
-
120
-
121
-
122
-
123
-
124
-
125
-
126
-
127
-
128
-
129
-
130
-
131
-
132
-
133
-
134
-
135
-
136
-
137
-
138
-
139
-
140
-
141
-
142
-
143
-
144
-
145
-
146
-
147
-
148
-
149
-
150
-
151
-
152
-
153
-
154
-
155
-
156
-
157
-
158
-
159
-
160
-
161
-
162
-
163
-
164
-
165
-
166
-
167
-
168
-
169
-
170
-
171
-
172
-
173
-
174
-
175
-
176
-
177
-
178
-
179
-
180
-
181
-
182
-
183
-
184
-
185
-
186
-
187
-
188
-
189
-
190
-
191
-
192
-
193
-
194
-
195
-
196
-
197
-
198
-
199
-
200
-
201
-
202
-
203
-
204
-
205
-
206
-
207
-
208
-
209
-
210
-
211
-
212
-
213
-
214
-
215
-
216
-
217
-
218
-
219
-
220
-
221
-
222
-
223
-
224
-
225
-
226
-
227
-
228
-
229
-
230
-
231
-
232
-
233
-
234
-
235
-
236
-
237
-
238
-
239
-
240
-
241
-
242
-
243
-
244
-
245
-
246
-
247
-
248
-
249
-
250
-
251
-
252
-
253
-
254
-
255
-
256
-
257
-
258
-
259
-
260
-
261
-
262
-
263
-
264
-
265
-
266
-
267
-
268
-
269
-
270
-
271
-
272
-
273
-
274
-
275
-
276
-
277
-
278
-
279
-
280
-
281
-
282
-
283
-
284
-
285
-
286
-
287
-
288
-
289
-
290
-
291
-
292
-
293
-
294
-
295
-
296
-
297
-
298
-
299
-
300
-
301
-
302
-
303
-
304
-
305
-
306
-
307
-
308
-
309
-
310
-
311
-
312
-
313
-
314
-
315
-
316
-
317
-
318
-
319
-
320
-
321
-
322
-
323
-
324
-
325
-
326
-
327
-
328
-
329
-
330
-
331
-
332
-
333
-
334
-
335
-
336
-
337
-
338
-
339
-
340
-
341
-
342
 |
 |
8
Citicorp
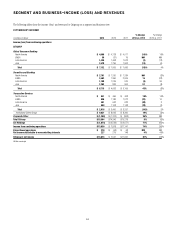
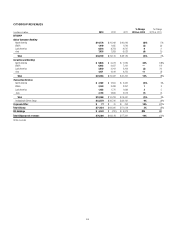
Citicorp net income increased 11% from the prior year to $15.6 billion. The
increase largely reflected a lower impact of CVA/DVA and lower repositioning
charges, partially offset by higher provisions for income taxes. CVA/DVA,
recorded in Securities and Banking, was a negative $345 million in
2013, compared to negative $2.5 billion in the prior year (for a summary
of CVA/DVA by business within Securities and Banking for 2013 and
comparable periods, see “Institutional Clients Group” below). Results in
the third quarter of 2013 also included the $176 million tax benefit in 2013,
compared to the $582 million tax benefit in the third quarter of 2012, and
the $189 million after-tax benefit related to the divestiture of Credicard.
Citicorp’s full year 2012 results included a pretax loss of $53 million
($34 million after-tax) related to the sale of minority investments as well as
$951 million of pretax repositioning charges in the fourth quarter of 2012
($604 million after-tax).
Excluding these items, Citicorp’s net income was $15.4 billion, down
1% from the prior year, as lower operating expenses and lower net credit
losses were largely offset by a lower net loan loss reserve release and a higher
effective tax rate in 2013.
Citicorp revenues, net of interest expense, increased 3% from the prior year
to $71.8 billion. Excluding CVA/DVA and the impact of minority investments,
Citicorp revenues were $72.2 billion in 2013, relatively unchanged from
2012. GCB revenues of $38.2 billion declined 2% versus the prior year. North
America GCB revenues declined 6% to $19.8 billion, and international GCB
revenues (consisting of Asia RCB, Latin America RCB and EMEA RCB)
increased 1% year-over-year to $18.4 billion. Excluding the impact of FX
translation, international GCB revenues rose 3% year-over-year, driven by
7% revenue growth in Latin America RCB, partially offset by a 1% revenue
decline in both EMEA RCB and Asia RCB. Securities and Banking revenues
were $23.0 billion in 2013, up 15% from the prior year. Excluding CVA/DVA,
Securities and Banking revenues were $23.4 billion, or 4% higher than
the prior year. Transaction Services revenues were $10.6 billion, down
1% from the prior year, but relatively unchanged excluding the impact
of FX translation (for the impact of FX translation on 2013 results of
operations for each of EMEA RCB, Latin America RCB, Asia RCB and
Transaction Services, see the table accompanying the discussion of each
respective business’ results of operations below). Corporate/Other revenues,
excluding the impact of minority investments, increased to $77 million from
$17 million in the prior year, mainly reflecting hedging gains.
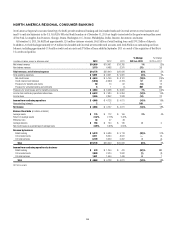
In North America RCB, the revenue decline was driven by lower mortgage
origination revenues due to the significant decline in U.S. mortgage
refinancing activity, particularly in the second half of the year, partially
offset by higher revenues in Citi retail services, mostly driven by the Best
Buy portfolio acquisition in the third quarter of 2013. North America RCB
average deposits of $166 billion grew 8% year-over-year and average retail
loans of $43 billion grew 3%. Average card loans of $107 billion declined
2%, driven by increased payment rates resulting from ongoing consumer
deleveraging, while card purchase sales of $240 billion increased 3% versus
the prior year. For additional information on the results of operations of
North America RCB for 2013, see “Global Consumer Banking—North
America Regional Consumer Banking” below.
Year-over-year, international GCB average deposits declined 2%, while
average retail loans increased 6%, investment sales increased 15%, average
card loans increased 3%, and international card purchase sales increased
7%, all excluding Credicard and the impact of FX translation. The decline
in Asia RCB revenues, excluding the impact of FX translation, reflected the
continued impact of spread compression, regulatory changes in certain
markets and the ongoing repositioning of Citi’s franchise in Korea. For
additional information on the results of operations of Asia RCB for 2013, see
“Global Consumer Banking—Asia Regional Consumer Banking” below.
In Securities and Banking, fixed income markets revenues of
$13.1 billion, excluding CVA/DVA, declined 7% from the prior year, primarily
reflecting industry-wide weakness in rates and currencies, partially offset
by strong performance in credit-related and securitized products and
commodities. Equity markets revenues of $3.0 billion in 2013, excluding
CVA/DVA, were 22% above the prior year driven primarily by market share
gains, continued improvement in cash and derivative trading performance
and a more favorable market environment. Investment banking revenues
rose 8% from the prior year to $4.0 billion, principally driven by higher
revenues in equity underwriting and advisory, partially offset by lower debt
underwriting revenues. Lending revenues of $1.2 billion increased 40% from
the prior year, driven by lower mark-to-market losses on hedges related to
accrual loans due to less significant credit spread tightening versus 2012.
Excluding the mark-to-market on hedges related to accrual loans, core
lending revenues decreased 4%, primarily due to increased hedge premium
costs and moderately lower loan balances, partially offset by higher spreads.
Private Bank revenues of $2.5 billion increased 4% from the prior year,
excluding CVA/DVA, with growth across all regions and products, particularly
in managed investments and capital markets. For additional information
on the results of operations of Securities and Banking for 2013, see
“Institutional Clients Group—Securities and Banking” below.
In Transaction Services, growth from higher deposit balances, trade
loans and fees from increased market volumes was offset by continued
spread compression. Excluding the impact of FX translation, Securities and
Fund Services revenues increased 4%, as growth in settlement volumes and
assets under custody were partially offset by spread compression related to
deposits. Treasury and Trade Solutions revenues decreased 1% excluding
the impact of FX translation, as the ongoing impact of spread compression
globally was partially offset by higher balances and fee growth. For additional
information on the results of operations of Transaction Services for 2013,
see “Institutional Clients Group—Transaction Services” below.
Citicorp end-of-period loans increased 6% year-over-year to $573 billion,
with 2% growth in Consumer loans and 11% growth in Corporate loans.