Citibank 2013 Annual Report Download - page 241
Download and view the complete annual report
Please find page 241 of the 2013 Citibank annual report below. You can navigate through the pages in the report by either clicking on the pages listed below, or by using the keyword search tool below to find specific information within the annual report.-
 1
1 -
2
-
3
-
4
-
5
-
6
-
7
-
8
-
9
-
10
-
11
-
12
-
13
-
14
-
15
-
16
-
17
-
18
-
19
-
20
-
21
-
22
-
23
-
24
-
25
-
26
-
27
-
28
-
29
-
30
-
31
-
32
-
33
-
34
-
35
-
36
-
37
-
38
-
39
-
40
-
41
-
42
-
43
-
44
-
45
-
46
-
47
-
48
-
49
-
50
-
51
-
52
-
53
-
54
-
55
-
56
-
57
-
58
-
59
-
60
-
61
-
62
-
63
-
64
-
65
-
66
-
67
-
68
-
69
-
70
-
71
-
72
-
73
-
74
-
75
-
76
-
77
-
78
-
79
-
80
-
81
-
82
-
83
-
84
-
85
-
86
-
87
-
88
-
89
-
90
-
91
-
92
-
93
-
94
-
95
-
96
-
97
-
98
-
99
-
100
-
101
-
102
-
103
-
104
-
105
-
106
-
107
-
108
-
109
-
110
-
111
-
112
-
113
-
114
-
115
-
116
-
117
-
118
-
119
-
120
-
121
-
122
-
123
-
124
-
125
-
126
-
127
-
128
-
129
-
130
-
131
-
132
-
133
-
134
-
135
-
136
-
137
-
138
-
139
-
140
-
141
-
142
-
143
-
144
-
145
-
146
-
147
-
148
-
149
-
150
-
151
-
152
-
153
-
154
-
155
-
156
-
157
-
158
-
159
-
160
-
161
-
162
-
163
-
164
-
165
-
166
-
167
-
168
-
169
-
170
-
171
-
172
-
173
-
174
-
175
-
176
-
177
-
178
-
179
-
180
-
181
-
182
-
183
-
184
-
185
-
186
-
187
-
188
-
189
-
190
-
191
-
192
-
193
-
194
-
195
-
196
-
197
-
198
-
199
-
200
-
201
-
202
-
203
-
204
-
205
-
206
-
207
-
208
-
209
-
210
-
211
-
212
-
213
-
214
-
215
-
216
-
217
-
218
-
219
-
220
-
221
-
222
-
223
-
224
-
225
-
226
-
227
-
228
-
229
-
230
-
 231
231 -
 232
232 -
 233
233 -
 234
234 -
 235
235 -
 236
236 -
 237
237 -
 238
238 -
 239
239 -
 240
240 -
 241
241 -
 242
242 -
 243
243 -
 244
244 -
 245
245 -
 246
246 -
 247
247 -
 248
248 -
 249
249 -
 250
250 -
 251
251 -
252
-
253
-
254
-
255
-
256
-
257
-
258
-
259
-
260
-
261
-
262
-
263
-
264
-
265
-
266
-
267
-
268
-
269
-
270
-
271
-
272
-
273
-
274
-
275
-
276
-
277
-
278
-
279
-
280
-
281
-
282
-
283
-
284
-
285
-
286
-
287
-
288
-
289
-
290
-
291
-
292
-
293
-
294
-
295
-
296
-
297
-
298
-
299
-
300
-
301
-
302
-
303
-
304
-
305
-
306
-
307
-
308
-
309
-
310
-
311
-
312
-
313
-
314
-
315
-
316
-
317
-
318
-
319
-
320
-
321
-
322
-
323
-
324
-
325
-
326
-
327
-
328
-
329
-
330
-
331
-
332
-
333
-
334
-
335
-
336
-
337
-
338
-
339
-
340
-
341
-
342
 |
 |

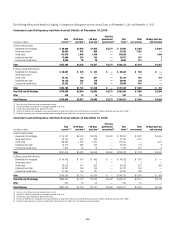
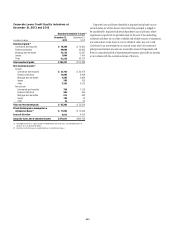
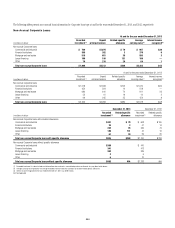
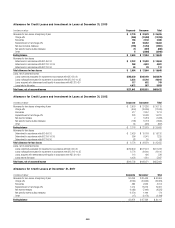
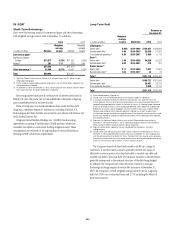
223
Corporate Loans Credit Quality Indicators at
December 31, 2013 and 2012
Recorded investment in loans (1)
In millions of dollars
December 31,
2013
December 31,
2012
Investment grade (2)
Commercial and industrial $ 79,360 $ 73,822
Financial institutions 49,699 43,895
Mortgage and real estate 13,178 12,587
Leases 1,600 1,404
Other 51,370 42,575
Total investment grade $195,207 $174,283
Non-investment grade (2)
Accrual
Commercial and industrial $ 33,702 $ 33,876
Financial institutions 12,005 9,968
Mortgage and real estate 4,205 2,858
Leases 385 559
Other 3,155 3,915
Non-accrual
Commercial and industrial 769 1,078
Financial institutions 365 454
Mortgage and real estate 515 680
Leases 189 52
Other 70 69
Total non-investment grade $ 55,360 $ 53,509
Private Banking loans managed on a
delinquency basis (2) $ 17,002 $ 14,945
Loans at fair value 4,072 4,056
Corporate loans, net of unearned income $271,641 $246,793
(1) Recorded investment in a loan includes net deferred loan fees and costs, unamortized premium or
discount, less any direct write-downs.
(2) Held-for-investment loans are accounted for on an amortized cost basis.
Corporate loans and leases identified as impaired and placed on non-
accrual status are written down to the extent that principal is judged to
be uncollectible. Impaired collateral-dependent loans and leases, where
repayment is expected to be provided solely by the sale of the underlying
collateral and there are no other available and reliable sources of repayment,
are written down to the lower of cost or collateral value, less cost to sell.
Cash-basis loans are returned to an accrual status when all contractual
principal and interest amounts are reasonably assured of repayment and
there is a sustained period of repayment performance, generally six months,
in accordance with the contractual terms of the loan.