Citibank 2013 Annual Report Download - page 166
Download and view the complete annual report
Please find page 166 of the 2013 Citibank annual report below. You can navigate through the pages in the report by either clicking on the pages listed below, or by using the keyword search tool below to find specific information within the annual report.-
 1
1 -
2
-
3
-
4
-
5
-
6
-
7
-
8
-
9
-
10
-
11
-
12
-
13
-
14
-
15
-
16
-
17
-
18
-
19
-
20
-
21
-
22
-
23
-
24
-
25
-
26
-
27
-
28
-
29
-
30
-
31
-
32
-
33
-
34
-
35
-
36
-
37
-
38
-
39
-
40
-
41
-
42
-
43
-
44
-
45
-
46
-
47
-
48
-
49
-
50
-
51
-
52
-
53
-
54
-
55
-
56
-
57
-
58
-
59
-
60
-
61
-
62
-
63
-
64
-
65
-
66
-
67
-
68
-
69
-
70
-
71
-
72
-
73
-
74
-
75
-
76
-
77
-
78
-
79
-
80
-
81
-
82
-
83
-
84
-
85
-
86
-
87
-
88
-
89
-
90
-
91
-
92
-
93
-
94
-
95
-
96
-
97
-
98
-
99
-
100
-
101
-
102
-
103
-
104
-
105
-
106
-
107
-
108
-
109
-
110
-
111
-
112
-
113
-
114
-
115
-
116
-
117
-
118
-
119
-
120
-
121
-
122
-
123
-
124
-
125
-
126
-
127
-
128
-
129
-
130
-
131
-
132
-
133
-
134
-
135
-
136
-
137
-
138
-
139
-
140
-
141
-
142
-
143
-
144
-
145
-
146
-
147
-
148
-
149
-
150
-
151
-
152
-
153
-
154
-
155
-
 156
156 -
 157
157 -
 158
158 -
 159
159 -
 160
160 -
 161
161 -
 162
162 -
 163
163 -
 164
164 -
 165
165 -
 166
166 -
 167
167 -
 168
168 -
 169
169 -
 170
170 -
 171
171 -
 172
172 -
 173
173 -
 174
174 -
 175
175 -
 176
176 -
177
-
178
-
179
-
180
-
181
-
182
-
183
-
184
-
185
-
186
-
187
-
188
-
189
-
190
-
191
-
192
-
193
-
194
-
195
-
196
-
197
-
198
-
199
-
200
-
201
-
202
-
203
-
204
-
205
-
206
-
207
-
208
-
209
-
210
-
211
-
212
-
213
-
214
-
215
-
216
-
217
-
218
-
219
-
220
-
221
-
222
-
223
-
224
-
225
-
226
-
227
-
228
-
229
-
230
-
231
-
232
-
233
-
234
-
235
-
236
-
237
-
238
-
239
-
240
-
241
-
242
-
243
-
244
-
245
-
246
-
247
-
248
-
249
-
250
-
251
-
252
-
253
-
254
-
255
-
256
-
257
-
258
-
259
-
260
-
261
-
262
-
263
-
264
-
265
-
266
-
267
-
268
-
269
-
270
-
271
-
272
-
273
-
274
-
275
-
276
-
277
-
278
-
279
-
280
-
281
-
282
-
283
-
284
-
285
-
286
-
287
-
288
-
289
-
290
-
291
-
292
-
293
-
294
-
295
-
296
-
297
-
298
-
299
-
300
-
301
-
302
-
303
-
304
-
305
-
306
-
307
-
308
-
309
-
310
-
311
-
312
-
313
-
314
-
315
-
316
-
317
-
318
-
319
-
320
-
321
-
322
-
323
-
324
-
325
-
326
-
327
-
328
-
329
-
330
-
331
-
332
-
333
-
334
-
335
-
336
-
337
-
338
-
339
-
340
-
341
-
342
 |
 |

148
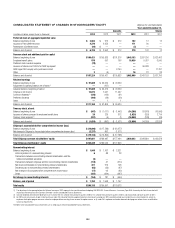
CONSOLIDATED FINANCIAL STATEMENTS
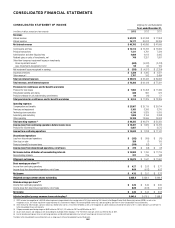
CONSOLIDATED STATEMENT OF INCOME Citigroup Inc. and Subsidiaries
Years ended December 31,
In millions of dollars, except per share amounts 2013 2012 2011
Revenues
Interest revenue $ 62,970 $ 67,298 $ 71,858
Interest expense 16,177 20,612 24,209
Net interest revenue $ 46,793 $ 46,686 $ 47,649
Commissions and fees $ 13,113 $ 12,732 $ 12,665
Principal transactions 7,121 4,781 7,234
Administration and other fiduciary fees 4,089 4,012 3,995
Realized gains on sales of investments, net 748 3,251 1,997
Other-than-temporary impairment losses on investments
Gross impairment losses (1) (633) (5,037) (2,413)
Less: Impairments recognized in AOCI 98 66 159
Net impairment losses recognized in earnings $ (535) $ (4,971) $ (2,254)
Insurance premiums $ 2,280 $ 2,395 $ 2,561
Other revenue (2) 2,757 242 3,484
Total non-interest revenues $ 29,573 $ 22,442 $ 29,682
Total revenues, net of interest expense $ 76,366 $ 69,128 $ 77,331
Provisions for credit losses and for benefits and claims
Provision for loan losses $ 7,604 $ 10,458 $ 11,336
Policyholder benefits and claims 830 887 972
Provision (release) for unfunded lending commitments 80 (16) 51
Total provisions for credit losses and for benefits and claims $ 8,514 $ 11,329 $ 12,359
Operating expenses
Compensation and benefits $ 23,967 $ 25,119 $ 25,614
Premises and equipment 3,165 3,266 3,310
Technology/communication 6,136 5,829 5,055
Advertising and marketing 1,888 2,164 2,268
Other operating 13,199 13,596 14,003
Total operating expenses (3) $ 48,355 $ 49,974 $ 50,250
Income (loss) from continuing operations before income taxes $ 19,497 $ 7,825 $ 14,722
Provision for income taxes 5,867 7 3,575
Income from continuing operations $ 13,630 $ 7,818 $ 11,147
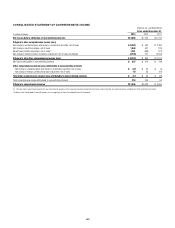
Discontinued operations
Loss from discontinued operations $ (242) $ (109) $ (75)
Gain (loss) on sale 268 (1) 155
Provision (benefit) for income taxes (244) (52) 12
Income (loss) from discontinued operations, net of taxes $ 270 $ (58) $ 68
Net income before attribution of noncontrolling interests $ 13,900 $ 7,760 $ 11,215
Noncontrolling interests 227 219 148
Citigroup’s net income $ 13,673 $ 7,541 $ 11,067
Basic earnings per share (4)(5)
Income from continuing operations $ 4.27 $ 2.53 $ 3.71
Income (loss) from discontinued operations, net of taxes 0.09 (0.02) 0.02
Net income $ 4.35 $ 2.51 $ 3.73
Weighted average common shares outstanding 3,035.8 2,930.6 2,909.8
Diluted earnings per share (4)(5)
Income from continuing operations $ 4.26 $ 2.46 $ 3.60
Income (loss) from discontinued operations, net of taxes 0.09 (0.02) 0.02
Net income $ 4.35 $ 2.44 $ 3.63
Adjusted weighted average common shares outstanding (4) 3,041.6 3,015.5 2,998.8
(1) 2012 includes the recognition of a $3,340 million impairment charge related to the carrying value of Citi’s then-remaining 35% interest in the Morgan Stanley Smith Barney joint venture (MSSB), as well as the
recognition of a $1,181 million impairment charge related to Citi’s investment in Akbank. The remaining MSSB interest was sold during 2013. See Note 14 to the Consolidated Financial Statements.
(2) Other revenue for 2012 includes a $1,344 million loss related to the sale of a 14% interest in MSSB, as well as the recognition of a $424 million loss related to the sale of a 10.1% stake in Akbank T.A.S. See Note 14
to the Consolidated Financial Statements.
(3) Citigroup recorded repositioning charges of $590 million for 2013, $1,375 million for 2012 and $706 million for 2011.
(4) All per share amounts and Citigroup shares outstanding for all periods reflect Citigroup’s 1-for-10 reverse stock split, which was effective May 6, 2011.
(5) Due to rounding, earnings per share on continuing operations and discontinued operations may not sum to earnings per share on net income.
The Notes to the Consolidated Financial Statements are an integral part of these Consolidated Financial Statements.