Citibank 2013 Annual Report Download - page 299
Download and view the complete annual report
Please find page 299 of the 2013 Citibank annual report below. You can navigate through the pages in the report by either clicking on the pages listed below, or by using the keyword search tool below to find specific information within the annual report.-
 1
1 -
2
-
3
-
4
-
5
-
6
-
7
-
8
-
9
-
10
-
11
-
12
-
13
-
14
-
15
-
16
-
17
-
18
-
19
-
20
-
21
-
22
-
23
-
24
-
25
-
26
-
27
-
28
-
29
-
30
-
31
-
32
-
33
-
34
-
35
-
36
-
37
-
38
-
39
-
40
-
41
-
42
-
43
-
44
-
45
-
46
-
47
-
48
-
49
-
50
-
51
-
52
-
53
-
54
-
55
-
56
-
57
-
58
-
59
-
60
-
61
-
62
-
63
-
64
-
65
-
66
-
67
-
68
-
69
-
70
-
71
-
72
-
73
-
74
-
75
-
76
-
77
-
78
-
79
-
80
-
81
-
82
-
83
-
84
-
85
-
86
-
87
-
88
-
89
-
90
-
91
-
92
-
93
-
94
-
95
-
96
-
97
-
98
-
99
-
100
-
101
-
102
-
103
-
104
-
105
-
106
-
107
-
108
-
109
-
110
-
111
-
112
-
113
-
114
-
115
-
116
-
117
-
118
-
119
-
120
-
121
-
122
-
123
-
124
-
125
-
126
-
127
-
128
-
129
-
130
-
131
-
132
-
133
-
134
-
135
-
136
-
137
-
138
-
139
-
140
-
141
-
142
-
143
-
144
-
145
-
146
-
147
-
148
-
149
-
150
-
151
-
152
-
153
-
154
-
155
-
156
-
157
-
158
-
159
-
160
-
161
-
162
-
163
-
164
-
165
-
166
-
167
-
168
-
169
-
170
-
171
-
172
-
173
-
174
-
175
-
176
-
177
-
178
-
179
-
180
-
181
-
182
-
183
-
184
-
185
-
186
-
187
-
188
-
189
-
190
-
191
-
192
-
193
-
194
-
195
-
196
-
197
-
198
-
199
-
200
-
201
-
202
-
203
-
204
-
205
-
206
-
207
-
208
-
209
-
210
-
211
-
212
-
213
-
214
-
215
-
216
-
217
-
218
-
219
-
220
-
221
-
222
-
223
-
224
-
225
-
226
-
227
-
228
-
229
-
230
-
231
-
232
-
233
-
234
-
235
-
236
-
237
-
238
-
239
-
240
-
241
-
242
-
243
-
244
-
245
-
246
-
247
-
248
-
249
-
250
-
251
-
252
-
253
-
254
-
255
-
256
-
257
-
258
-
259
-
260
-
261
-
262
-
263
-
264
-
265
-
266
-
267
-
268
-
269
-
270
-
271
-
272
-
273
-
274
-
275
-
276
-
277
-
278
-
279
-
280
-
281
-
282
-
283
-
284
-
285
-
286
-
287
-
288
-
 289
289 -
 290
290 -
 291
291 -
 292
292 -
 293
293 -
 294
294 -
 295
295 -
 296
296 -
 297
297 -
 298
298 -
 299
299 -
 300
300 -
 301
301 -
 302
302 -
 303
303 -
 304
304 -
 305
305 -
 306
306 -
 307
307 -
 308
308 -
 309
309 -
310
-
311
-
312
-
313
-
314
-
315
-
316
-
317
-
318
-
319
-
320
-
321
-
322
-
323
-
324
-
325
-
326
-
327
-
328
-
329
-
330
-
331
-
332
-
333
-
334
-
335
-
336
-
337
-
338
-
339
-
340
-
341
-
342
 |
 |

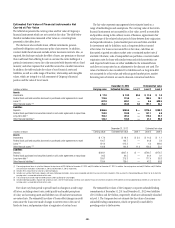
281
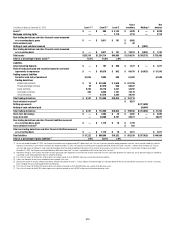
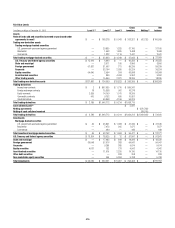
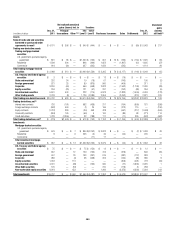
In millions of dollars
Dec. 31,
2011
Net realized/unrealized
gains (losses) incl. in Transfers
Purchases Issuances Sales Settlements
Dec. 31,
2012
Unrealized
gains
(losses)
still held (3)
Principal
transactions Other (1)(2)
into
Level 3
out of
Level 3
Loans $ 4,682 $ — $ (34) $ 1,051 $ (185) $ 301 $ 930 $ (251) $(1,563) $ 4,931 $ 156
Mortgage servicing rights 2,569 — (426) — — 2 421 (5) (619) 1,942 (427)
Other financial assets measured on
a recurring basis 2,245 — 366 21 (35) 4 1,700 (50) (1,799) 2,452 101
Liabilities
Interest-bearing deposits $ 431 $ — $(141) $ 213 $ (36) $ — $ 268 $ — $ (231) $ 786 $ (414)
Federal funds purchased and
securities loaned or sold under
agreements to repurchase 1,061 (64) — — (14) — — (179) (91) 841 43
Trading account liabilities
Securities sold, not yet purchased 412 (1) — 294 (47) — — 216 (511) 365 (42)
Short-term borrowings 499 (108) — 47 (20) — 268 — (790) 112 (57)
Long-term debt 6,904 98 119 2,548 (2,694) — 2,480 — (2,295) 6,726 (688)
Other financial liabilities measured
on a recurring basis 3 — (31) 2 (2) (4) 6 — (12) 24 (13)
(1) Changes in fair value for available-for-sale investments are recorded in Accumulated other comprehensive income (loss), unless other-than-temporarily impaired, while gains and losses from sales are recorded in
Realized gains (losses) from sales of investments on the Consolidated Statement of Income.
(2) Unrealized gains (losses) on MSRs are recorded in Other revenue on the Consolidated Statement of Income.
(3) Represents the amount of total gains or losses for the period, included in earnings (and Accumulated other comprehensive income (loss) for changes in fair value for available-for-sale investments), attributable to the
change in fair value relating to assets and liabilities classified as Level 3 that are still held at December 31, 2013.
(4) Total Level 3 derivative assets and liabilities have been netted in these tables for presentation purposes only.
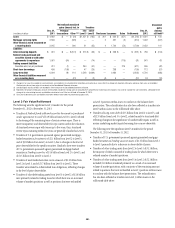
Level 3 Fair Value Rollforward
The following were the significant Level 3 transfers for the period
December 31, 2012 to December 31, 2013:
•Transfers of Federal funds sold and securities borrowed or purchased
under agreements to resell of $1.9 billion from Level 3 to Level 2 related
to shortening of the remaining tenor of certain reverse repos. There is
more transparency and observability for repo curves used in the valuation
of structured reverse repos with tenors up to five years; thus, structured
reverse repos maturing within five years are generally classified as Level 2.
•Transfers of U.S. government-sponsored agency guaranteed mortgage-
backed securities in Investments of $2.1 billion from Level 2 to Level 3,
and of $3.8 billion from Level 3 to Level 2, due to changes in the level of
price observability for the specific securities. Similarly, there were transfers
of U.S. government-sponsored agency guaranteed mortgage-backed
securities in Trading securities of $1.4 billion from Level 2 to Level 3, and
of $1.5 billion from Level 3 to Level 2.
•Transfers of asset-backed securities in Investments of $1.2 billion from
Level 2 to Level 3, and of $1.7 billion from Level 3 to Level 2. These
transfers were related to collateralized loan obligations, reflecting changes
in the level of price observability.
•Transfers of other debt trading assets from Level 3 to Level 2 of $1.6 billion
were primarily related to trading loans for which there was an increased
volume of market quotations as well as positions that were reclassified
as Level 3 positions within Loans to conform to the balance sheet
presentation. The reclassification has also been reflected as transfers into
Level 3 within Loans in the rollforward table above.
•Transfers of Long-term debt of $2.5 billion from Level 2 to Level 3, and
of $2.5 billion from Level 3 to Level 2, related mainly to structured debt
reflecting changes in the significance of unobservable inputs as well as
certain underlying market inputs becoming less or more observable.
The following were the significant Level 3 transfers for the period
December 31, 2011 to December 31, 2012:
• Transfers of U.S. government-sponsored agency guaranteed mortgage-
backed securities in Trading account assets of $1.3 billion from Level 2
to Level 3 primarily due to a decrease in observability of prices.
• Transfers of other trading assets from Level 2 to Level 3 of $1.1 billion,
the majority of which consisted of trading loans for which there were a
reduced number of market quotations.
• Transfers of other trading assets from Level 3 to Level 2 of $2.1 billion
included $1.0 billion transfered primarily as a result of an increased
volume of market quotations, with a majority of the remaining amount
related to positions that were reclassified as Level 3 positions within Loans
to conform with the balance sheet presentation. The reclassification
has also been reflected as transfers into Level 3 within Loans in the
rollforward table above.