Citibank 2013 Annual Report Download - page 54
Download and view the complete annual report
Please find page 54 of the 2013 Citibank annual report below. You can navigate through the pages in the report by either clicking on the pages listed below, or by using the keyword search tool below to find specific information within the annual report.-
 1
1 -
2
-
3
-
4
-
5
-
6
-
7
-
8
-
9
-
10
-
11
-
12
-
13
-
14
-
15
-
16
-
17
-
18
-
19
-
20
-
21
-
22
-
23
-
24
-
25
-
26
-
27
-
28
-
29
-
30
-
31
-
32
-
33
-
34
-
35
-
36
-
37
-
38
-
39
-
40
-
41
-
42
-
43
-
 44
44 -
 45
45 -
 46
46 -
 47
47 -
 48
48 -
 49
49 -
 50
50 -
 51
51 -
 52
52 -
 53
53 -
 54
54 -
 55
55 -
 56
56 -
 57
57 -
 58
58 -
 59
59 -
 60
60 -
 61
61 -
 62
62 -
 63
63 -
 64
64 -
65
-
66
-
67
-
68
-
69
-
70
-
71
-
72
-
73
-
74
-
75
-
76
-
77
-
78
-
79
-
80
-
81
-
82
-
83
-
84
-
85
-
86
-
87
-
88
-
89
-
90
-
91
-
92
-
93
-
94
-
95
-
96
-
97
-
98
-
99
-
100
-
101
-
102
-
103
-
104
-
105
-
106
-
107
-
108
-
109
-
110
-
111
-
112
-
113
-
114
-
115
-
116
-
117
-
118
-
119
-
120
-
121
-
122
-
123
-
124
-
125
-
126
-
127
-
128
-
129
-
130
-
131
-
132
-
133
-
134
-
135
-
136
-
137
-
138
-
139
-
140
-
141
-
142
-
143
-
144
-
145
-
146
-
147
-
148
-
149
-
150
-
151
-
152
-
153
-
154
-
155
-
156
-
157
-
158
-
159
-
160
-
161
-
162
-
163
-
164
-
165
-
166
-
167
-
168
-
169
-
170
-
171
-
172
-
173
-
174
-
175
-
176
-
177
-
178
-
179
-
180
-
181
-
182
-
183
-
184
-
185
-
186
-
187
-
188
-
189
-
190
-
191
-
192
-
193
-
194
-
195
-
196
-
197
-
198
-
199
-
200
-
201
-
202
-
203
-
204
-
205
-
206
-
207
-
208
-
209
-
210
-
211
-
212
-
213
-
214
-
215
-
216
-
217
-
218
-
219
-
220
-
221
-
222
-
223
-
224
-
225
-
226
-
227
-
228
-
229
-
230
-
231
-
232
-
233
-
234
-
235
-
236
-
237
-
238
-
239
-
240
-
241
-
242
-
243
-
244
-
245
-
246
-
247
-
248
-
249
-
250
-
251
-
252
-
253
-
254
-
255
-
256
-
257
-
258
-
259
-
260
-
261
-
262
-
263
-
264
-
265
-
266
-
267
-
268
-
269
-
270
-
271
-
272
-
273
-
274
-
275
-
276
-
277
-
278
-
279
-
280
-
281
-
282
-
283
-
284
-
285
-
286
-
287
-
288
-
289
-
290
-
291
-
292
-
293
-
294
-
295
-
296
-
297
-
298
-
299
-
300
-
301
-
302
-
303
-
304
-
305
-
306
-
307
-
308
-
309
-
310
-
311
-
312
-
313
-
314
-
315
-
316
-
317
-
318
-
319
-
320
-
321
-
322
-
323
-
324
-
325
-
326
-
327
-
328
-
329
-
330
-
331
-
332
-
333
-
334
-
335
-
336
-
337
-
338
-
339
-
340
-
341
-
342
 |
 |

36
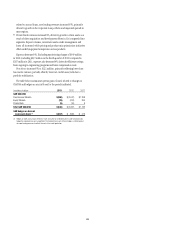
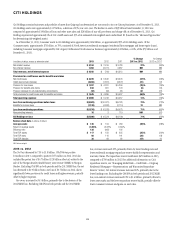
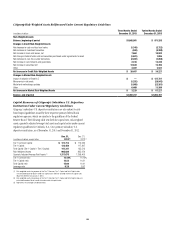
BALANCE SHEET REVIEW
The following sets forth a general discussion of the changes in certain of the more significant line items of Citi’s Consolidated Balance Sheet. For additional
information on Citigroup’s liquidity resources, including its deposits, short-term and long-term debt and secured financing transactions, see “Managing Global
Risk—Market Risk—Funding and Liquidity” below.
In billions of dollars
December 31,
2013
September 30,
2013
December 31,
2012
EOP
4Q13 vs. 3Q13
Increase
(decrease)
%
Change
EOP
4Q13 vs. 4Q12
Increase
(decrease)
%
Change
Assets
Cash and deposits with banks $ 199 $ 205 $ 139 $ (6) (3)% $ 60 43%
Federal funds sold and securities borrowed
or purchased under agreements to resell 257 274 261 (17) (6) (4) (2)
Trading account assets 286 292 321 (6) (2) (35) (11)
Investments 309 304 312 5 2 (3) (1)
Loans, net of unearned income and
allowance for loan losses 646 637 630 9 1 16 3
Other assets 183 188 202 (5) (3) (19) (9)
Total assets $1,880 $1,900 $1,865 $(20) (1)% $ 15 1%
Liabilities
Deposits $ 968 $ 955 $ 931 $ 13 1% $ 37 4%
Federal funds purchased and securities loaned or sold
under agreements to repurchase 204 216 211 (12) (6) (7) (3)
Trading account liabilities 109 122 116 (13) (11) (7) (6)
Short-term borrowings 59 59 52 — — 7 13
Long-term debt 221 222 239 (1) — (18) (8)
Other liabilities 113 123 125 (10) (8) (12) (10)
Total liabilities $1,674 $1,697 $1,674 $(23) (1)% $ — —%
Total equity 206 203 191 3 1 15 8
Total liabilities and equity $1,880 $1,900 $1,865 $(20) (1)% $ 15 1%
ASSETS
Cash and Deposits with Banks
Cash and deposits with banks is composed of both Cash and due from
banks and Deposits with banks. Cash and due from banks includes
(i) cash on hand at Citi’s domestic and overseas offices, and (ii) non-
interest-bearing balances due from banks, including non-interest-bearing
demand deposit accounts with correspondent banks, central banks (such
as the Federal Reserve Bank), and other banks or depository institutions for
normal operating purposes. Deposits with banks includes interest-bearing
balances, demand deposits and time deposits held in or due from banks
(including correspondent banks, central banks and other banks or depository
institutions) maintained for, among other things, normal operating and
regulatory reserve requirement purposes.
During 2013, cash and deposits with banks increased 43%, driven by
a $67 billion, or 65%, increase in Deposits with banks, reflecting the
growth in Citi’s deposits during the year (for additional information, see
“Managing Global Risk—Market Risk—Funding and Liquidity” below).
Sequentially, cash and deposits with banks decreased 3%, primarily driven
by net loan growth and higher net trading account assets within Securities
and Banking, as trading account liabilities decreased by more than trading
account assets, as discussed below, partially offset by higher deposits in
Transaction Services and sales related to the continued reduction of Citi
Holdings assets.
Average cash balances were $204 billion in the fourth quarter of 2013,
compared to $180 billion in the third quarter of 2013.
Federal Funds Sold and Securities Borrowed or
Purchased Under Agreements to Resell (Reverse Repos)
Federal funds sold consist of unsecured advances to third parties of excess
balances in reserve accounts held at the Federal Reserve Bank. For the full
year and fourth quarter of 2013, Citi’s federal funds sold were not significant.
Reverse repos and securities borrowed decreased 6% quarter-over-quarter,
primarily due to a reduction in trading in the Markets businesses within
Securities and Banking as counterparties became more cautious during
the second half of 2013 as they reacted to potential tapering by the Federal
Reserve Board and possible U.S. government default.
For further information regarding these balance sheet categories, see
Note 11 to the Consolidated Financial Statements.