Citibank 2013 Annual Report Download - page 45
Download and view the complete annual report
Please find page 45 of the 2013 Citibank annual report below. You can navigate through the pages in the report by either clicking on the pages listed below, or by using the keyword search tool below to find specific information within the annual report.-
 1
1 -
2
-
3
-
4
-
5
-
6
-
7
-
8
-
9
-
10
-
11
-
12
-
13
-
14
-
15
-
16
-
17
-
18
-
19
-
20
-
21
-
22
-
23
-
24
-
25
-
26
-
27
-
28
-
29
-
30
-
31
-
32
-
33
-
34
-
 35
35 -
 36
36 -
 37
37 -
 38
38 -
 39
39 -
 40
40 -
 41
41 -
 42
42 -
 43
43 -
 44
44 -
 45
45 -
 46
46 -
 47
47 -
 48
48 -
 49
49 -
 50
50 -
 51
51 -
 52
52 -
 53
53 -
 54
54 -
 55
55 -
56
-
57
-
58
-
59
-
60
-
61
-
62
-
63
-
64
-
65
-
66
-
67
-
68
-
69
-
70
-
71
-
72
-
73
-
74
-
75
-
76
-
77
-
78
-
79
-
80
-
81
-
82
-
83
-
84
-
85
-
86
-
87
-
88
-
89
-
90
-
91
-
92
-
93
-
94
-
95
-
96
-
97
-
98
-
99
-
100
-
101
-
102
-
103
-
104
-
105
-
106
-
107
-
108
-
109
-
110
-
111
-
112
-
113
-
114
-
115
-
116
-
117
-
118
-
119
-
120
-
121
-
122
-
123
-
124
-
125
-
126
-
127
-
128
-
129
-
130
-
131
-
132
-
133
-
134
-
135
-
136
-
137
-
138
-
139
-
140
-
141
-
142
-
143
-
144
-
145
-
146
-
147
-
148
-
149
-
150
-
151
-
152
-
153
-
154
-
155
-
156
-
157
-
158
-
159
-
160
-
161
-
162
-
163
-
164
-
165
-
166
-
167
-
168
-
169
-
170
-
171
-
172
-
173
-
174
-
175
-
176
-
177
-
178
-
179
-
180
-
181
-
182
-
183
-
184
-
185
-
186
-
187
-
188
-
189
-
190
-
191
-
192
-
193
-
194
-
195
-
196
-
197
-
198
-
199
-
200
-
201
-
202
-
203
-
204
-
205
-
206
-
207
-
208
-
209
-
210
-
211
-
212
-
213
-
214
-
215
-
216
-
217
-
218
-
219
-
220
-
221
-
222
-
223
-
224
-
225
-
226
-
227
-
228
-
229
-
230
-
231
-
232
-
233
-
234
-
235
-
236
-
237
-
238
-
239
-
240
-
241
-
242
-
243
-
244
-
245
-
246
-
247
-
248
-
249
-
250
-
251
-
252
-
253
-
254
-
255
-
256
-
257
-
258
-
259
-
260
-
261
-
262
-
263
-
264
-
265
-
266
-
267
-
268
-
269
-
270
-
271
-
272
-
273
-
274
-
275
-
276
-
277
-
278
-
279
-
280
-
281
-
282
-
283
-
284
-
285
-
286
-
287
-
288
-
289
-
290
-
291
-
292
-
293
-
294
-
295
-
296
-
297
-
298
-
299
-
300
-
301
-
302
-
303
-
304
-
305
-
306
-
307
-
308
-
309
-
310
-
311
-
312
-
313
-
314
-
315
-
316
-
317
-
318
-
319
-
320
-
321
-
322
-
323
-
324
-
325
-
326
-
327
-
328
-
329
-
330
-
331
-
332
-
333
-
334
-
335
-
336
-
337
-
338
-
339
-
340
-
341
-
342
 |
 |

27
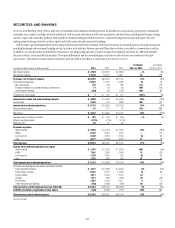
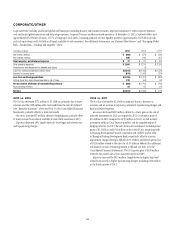
SECURITIES AND BANKING
Securities and Banking (S&B) offers a wide array of investment and commercial banking services and products for corporations, governments, institutional
and public sector entities and high-net-worth individuals. S&B transacts with clients in both cash instruments and derivatives, including fixed income, foreign
currency, equity and commodity products. S&B includes investment banking and advisory services, corporate lending, fixed income and equity sales and
trading, prime brokerage, derivative services, equity and fixed income research and private banking.
S&B revenue is generated primarily from fees and spreads associated with these activities. S&B earns fee income for assisting clients in clearing transactions,
providing brokerage and investment banking services and other such activities. Revenue generated from these activities is recorded in Commissions and fees.
In addition, as a market maker, S&B facilitates transactions, including holding product inventory to meet client demand, and earns the differential between
the price at which it buys and sells the products. These price differentials and the unrealized gains and losses on the inventory are recorded in Principal
transactions. S&B interest income earned on inventory and loans held is recorded as a component of Net interest revenue.
In millions of dollars, except as otherwise noted 2013 2012 2011
% Change
2013 vs. 2012
% Change
2012 vs. 2011
Net interest revenue $ 9,909 $9,951 $ 9,399 —% 6%
Non-interest revenue 13,109 10,071 12,301 30 (18)
Revenues, net of interest expense $ 23,018 $20,022 $21,700 15% (8)%
Total operating expenses 13,803 14,416 14,990 (4) (4)
Net credit losses 145 168 602 (14) (72)
Provision (release) for unfunded lending commitments 71 33 86 NM (62)
Credit reserve (release) (209) (79) (572) NM 86
Provisions for credit losses $ 7 $ 122 $ 116 (94)% 5%
Income before taxes and noncontrolling interests $ 9,208 $ 5,484 $ 6,594 68% (17)%
Income taxes 2,493 791 1,485 NM (47)
Income from continuing operations $ 6,715 $ 4,693 $ 5,109 43% (8)%
Noncontrolling interests 91 111 37 (18) NM
Net income $ 6,624 $ 4,582 $ 5,072 45% (10)%
Average assets (in billions of dollars) $ 907 $ 904 $ 896 —% 1%
Return on average assets 0.73% 0.51% 0.57%
Efficiency ratio 60 72 69
Revenues by region
North America $ 9,045 $ 6,473 $ 7,925 40% (18)%
EMEA 6,462 6,437 7,241 —(11)
Latin America 2,840 2,913 2,264 (3) 29
Asia 4,671 4,199 4,270 11 (2)
Total revenues $ 23,018 $20,022 $21,700 15% (8)%
Income from continuing operations by region
North America $ 2,701 $ 1,250 $ 1,284 NM (3)%
EMEA 1,562 1,360 2,005 15 (32)
Latin America 1,189 1,249 916 (5) 36
Asia 1,263 834 904 51 (8)
Total income from continuing operations $ 6,715 $ 4,693 $ 5,109 43% (8)%
Securities and Banking revenue details (excluding CVA/DVA)
Total investment banking $ 3,977 $ 3,668 $ 3,334 8% 10%
Fixed income markets 13,107 14,122 11,050 (7) 28
Equity markets 3,017 2,464 2,451 22 1
Lending 1,217 869 1,682 40 (48)
Private bank 2,487 2,394 2,217 48
Other Securities and Banking (442) (1,008) (766) 56 (32)
Total Securities and Banking revenues (ex-CVA/DVA) $ 23,363 $22,509 $19,968 4% 13%
CVA/DVA (excluded as applicable in lines above) (345) (2,487) 1,732 86% NM
Total revenues, net of interest expense $ 23,018 $20,022 $21,700 15% (8)%
NM Not meaningful