Citibank 2013 Annual Report Download - page 204
Download and view the complete annual report
Please find page 204 of the 2013 Citibank annual report below. You can navigate through the pages in the report by either clicking on the pages listed below, or by using the keyword search tool below to find specific information within the annual report.-
 1
1 -
2
-
3
-
4
-
5
-
6
-
7
-
8
-
9
-
10
-
11
-
12
-
13
-
14
-
15
-
16
-
17
-
18
-
19
-
20
-
21
-
22
-
23
-
24
-
25
-
26
-
27
-
28
-
29
-
30
-
31
-
32
-
33
-
34
-
35
-
36
-
37
-
38
-
39
-
40
-
41
-
42
-
43
-
44
-
45
-
46
-
47
-
48
-
49
-
50
-
51
-
52
-
53
-
54
-
55
-
56
-
57
-
58
-
59
-
60
-
61
-
62
-
63
-
64
-
65
-
66
-
67
-
68
-
69
-
70
-
71
-
72
-
73
-
74
-
75
-
76
-
77
-
78
-
79
-
80
-
81
-
82
-
83
-
84
-
85
-
86
-
87
-
88
-
89
-
90
-
91
-
92
-
93
-
94
-
95
-
96
-
97
-
98
-
99
-
100
-
101
-
102
-
103
-
104
-
105
-
106
-
107
-
108
-
109
-
110
-
111
-
112
-
113
-
114
-
115
-
116
-
117
-
118
-
119
-
120
-
121
-
122
-
123
-
124
-
125
-
126
-
127
-
128
-
129
-
130
-
131
-
132
-
133
-
134
-
135
-
136
-
137
-
138
-
139
-
140
-
141
-
142
-
143
-
144
-
145
-
146
-
147
-
148
-
149
-
150
-
151
-
152
-
153
-
154
-
155
-
156
-
157
-
158
-
159
-
160
-
161
-
162
-
163
-
164
-
165
-
166
-
167
-
168
-
169
-
170
-
171
-
172
-
173
-
174
-
175
-
176
-
177
-
178
-
179
-
180
-
181
-
182
-
183
-
184
-
185
-
186
-
187
-
188
-
189
-
190
-
191
-
192
-
193
-
 194
194 -
 195
195 -
 196
196 -
 197
197 -
 198
198 -
 199
199 -
 200
200 -
 201
201 -
 202
202 -
 203
203 -
 204
204 -
 205
205 -
 206
206 -
 207
207 -
 208
208 -
 209
209 -
 210
210 -
 211
211 -
 212
212 -
 213
213 -
 214
214 -
215
-
216
-
217
-
218
-
219
-
220
-
221
-
222
-
223
-
224
-
225
-
226
-
227
-
228
-
229
-
230
-
231
-
232
-
233
-
234
-
235
-
236
-
237
-
238
-
239
-
240
-
241
-
242
-
243
-
244
-
245
-
246
-
247
-
248
-
249
-
250
-
251
-
252
-
253
-
254
-
255
-
256
-
257
-
258
-
259
-
260
-
261
-
262
-
263
-
264
-
265
-
266
-
267
-
268
-
269
-
270
-
271
-
272
-
273
-
274
-
275
-
276
-
277
-
278
-
279
-
280
-
281
-
282
-
283
-
284
-
285
-
286
-
287
-
288
-
289
-
290
-
291
-
292
-
293
-
294
-
295
-
296
-
297
-
298
-
299
-
300
-
301
-
302
-
303
-
304
-
305
-
306
-
307
-
308
-
309
-
310
-
311
-
312
-
313
-
314
-
315
-
316
-
317
-
318
-
319
-
320
-
321
-
322
-
323
-
324
-
325
-
326
-
327
-
328
-
329
-
330
-
331
-
332
-
333
-
334
-
335
-
336
-
337
-
338
-
339
-
340
-
341
-
342
 |
 |

186
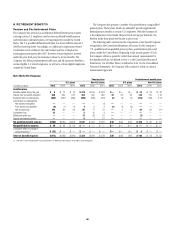
Discount Rate
The discount rates for the U.S. pension and postretirement plans were selected
by reference to a Citigroup-specific analysis using each plan’s specific
cash flows and compared with high-quality corporate bond indices for
reasonableness. Citigroup’s policy is to round to the nearest five hundredths
of a percent. The discount rates for the non-U.S. pension and postretirement
plans are selected by reference to high-quality corporate bond rates in
countries that have developed corporate bond markets. However, where
developed corporate bond markets do not exist, the discount rates are selected
by reference to local government bond rates with a premium added to reflect
the additional risk for corporate bonds in certain countries.
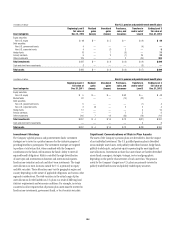
Expected Rate of Return
The Company determines its assumptions for the expected rate of return
on plan assets for its U.S. pension and postretirement plans using a
“building block” approach, which focuses on ranges of anticipated rates
of return for each asset class. A weighted average range of nominal rates
is then determined based on target allocations to each asset class. Market
performance over a number of earlier years is evaluated covering a wide
range of economic conditions to determine whether there are sound reasons
for projecting any past trends.
The Company considers the expected rate of return to be a long-term
assessment of return expectations and does not anticipate changing this
assumption unless there are significant changes in investment strategy
or economic conditions. This contrasts with the selection of the discount
rate and certain other assumptions, which are reconsidered annually in
accordance with generally accepted accounting principles.
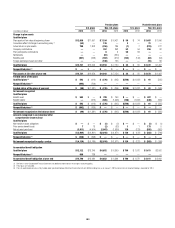
The expected rate of return for the U.S. pension and postretirement plans
was 7.00% at December 31, 2013, 7.00% at December 31, 2012, and 7.50%
at December 31, 2011. The expected return on assets reflects the expected
annual appreciation of the plan assets and reduces the Company’s annual
pension expense. The expected return on assets is deducted from the sum
of service cost, interest cost and other components of pension expense to
arrive at the net pension (benefit) expense. Net pension (benefit) expense for
the U.S. pension plans for 2013, 2012 and 2011 reflects deductions of $863
million, $897 million and $890 million of expected returns, respectively.
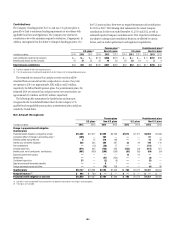
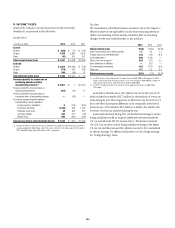
The following table shows the expected rate of return used in determining the
Company’s pension expense compared to the actual rate of return on plan assets
during 2013, 2012 and 2011 for the U.S. pension and postretirement plans:
2013 2012 2011
Expected rate of return (1) 7.00% 7.50% 7.50%
Actual rate of return (2) 6.00% 11.00% 11.00%
(1) Effective December 31, 2012, the expected rate of return was changed from 7.50% to 7.00%.
(2) Actual rates of return are presented net of fees.
For the non-U.S. plans, pension expense for 2013 was reduced by the
expected return of $396 million, compared with the actual return of $(130)
million. Pension expense for 2012 and 2011 was reduced by expected returns
of $399 million and $422 million, respectively. Actual returns were lower in
2013, but higher in 2012 and 2011 than the expected returns in those years.
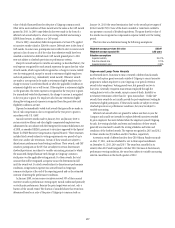
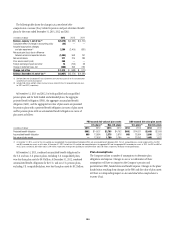
Sensitivities of Certain Key Assumptions
The following tables summarize the effect on pension expense of a one-
percentage-point change in the discount rate:
One-percentage-point increase
In millions of dollars 2013 2012 2011
U.S. plans $ 16 $ 18 $ 19
Non-U.S. plans (52) (48) (57)
One-percentage-point decrease
In millions of dollars 2013 2012 2011
U.S. plans $(57) $(36) $(34)
Non-U.S. plans 79 64 70
Since the U.S. qualified pension plan was frozen, the majority of the
prospective service cost has been eliminated and the gain/loss amortization
period was changed to the life expectancy for inactive participants. As a
result, pension expense for the U.S. qualified pension plan is driven more
by interest costs than service costs, and an increase in the discount rate
would increase pension expense, while a decrease in the discount rate would
decrease pension expense.
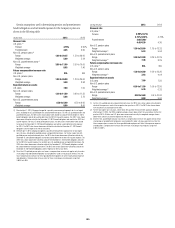
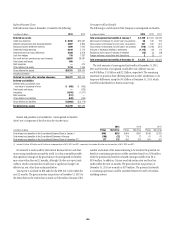
The following tables summarize the effect on pension expense of a one-
percentage-point change in the expected rates of return:
One-percentage-point increase
In millions of dollars 2013 2012 2011
U.S. plans $(123) $(120) $(118)
Non-U.S. plans (68) (64) (62)
One-percentage-point decrease
In millions of dollars 2013 2012 2011
U.S. plans $123 $ 120 $ 118
Non-U.S. plans 68 64 62
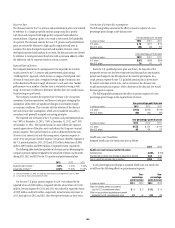
Health Care Cost-Trend Rate
Assumed health care cost-trend rates were as follows:
2013 2012
Health care cost increase rate for U.S. plans
Following year 8.00% 8.50%
Ultimate rate to which cost increase is assumed to decline 5.00 5.00
Year in which the ultimate rate is reached 2020 2020
A one-percentage-point change in assumed health care cost-trend rates
would have the following effects on postretirement expense:
One-
percentage-
point increase
One-
percentage-
point decrease
In millions of dollars 2013 2012 2013 2012
Effect on benefits earned and interest
cost for U.S. postretirement plans $ 1 $ 2 $ (1) $ (1)
Effect on accumulated postretirement benefit
obligation for U.S. postretirement plans 24 44 (19) (39)