Citibank 2013 Annual Report Download - page 94
Download and view the complete annual report
Please find page 94 of the 2013 Citibank annual report below. You can navigate through the pages in the report by either clicking on the pages listed below, or by using the keyword search tool below to find specific information within the annual report.-
 1
1 -
2
-
3
-
4
-
5
-
6
-
7
-
8
-
9
-
10
-
11
-
12
-
13
-
14
-
15
-
16
-
17
-
18
-
19
-
20
-
21
-
22
-
23
-
24
-
25
-
26
-
27
-
28
-
29
-
30
-
31
-
32
-
33
-
34
-
35
-
36
-
37
-
38
-
39
-
40
-
41
-
42
-
43
-
44
-
45
-
46
-
47
-
48
-
49
-
50
-
51
-
52
-
53
-
54
-
55
-
56
-
57
-
58
-
59
-
60
-
61
-
62
-
63
-
64
-
65
-
66
-
67
-
68
-
69
-
70
-
71
-
72
-
73
-
74
-
75
-
76
-
77
-
78
-
79
-
80
-
81
-
82
-
83
-
 84
84 -
 85
85 -
 86
86 -
 87
87 -
 88
88 -
 89
89 -
 90
90 -
 91
91 -
 92
92 -
 93
93 -
 94
94 -
 95
95 -
 96
96 -
 97
97 -
 98
98 -
 99
99 -
 100
100 -
 101
101 -
 102
102 -
 103
103 -
 104
104 -
105
-
106
-
107
-
108
-
109
-
110
-
111
-
112
-
113
-
114
-
115
-
116
-
117
-
118
-
119
-
120
-
121
-
122
-
123
-
124
-
125
-
126
-
127
-
128
-
129
-
130
-
131
-
132
-
133
-
134
-
135
-
136
-
137
-
138
-
139
-
140
-
141
-
142
-
143
-
144
-
145
-
146
-
147
-
148
-
149
-
150
-
151
-
152
-
153
-
154
-
155
-
156
-
157
-
158
-
159
-
160
-
161
-
162
-
163
-
164
-
165
-
166
-
167
-
168
-
169
-
170
-
171
-
172
-
173
-
174
-
175
-
176
-
177
-
178
-
179
-
180
-
181
-
182
-
183
-
184
-
185
-
186
-
187
-
188
-
189
-
190
-
191
-
192
-
193
-
194
-
195
-
196
-
197
-
198
-
199
-
200
-
201
-
202
-
203
-
204
-
205
-
206
-
207
-
208
-
209
-
210
-
211
-
212
-
213
-
214
-
215
-
216
-
217
-
218
-
219
-
220
-
221
-
222
-
223
-
224
-
225
-
226
-
227
-
228
-
229
-
230
-
231
-
232
-
233
-
234
-
235
-
236
-
237
-
238
-
239
-
240
-
241
-
242
-
243
-
244
-
245
-
246
-
247
-
248
-
249
-
250
-
251
-
252
-
253
-
254
-
255
-
256
-
257
-
258
-
259
-
260
-
261
-
262
-
263
-
264
-
265
-
266
-
267
-
268
-
269
-
270
-
271
-
272
-
273
-
274
-
275
-
276
-
277
-
278
-
279
-
280
-
281
-
282
-
283
-
284
-
285
-
286
-
287
-
288
-
289
-
290
-
291
-
292
-
293
-
294
-
295
-
296
-
297
-
298
-
299
-
300
-
301
-
302
-
303
-
304
-
305
-
306
-
307
-
308
-
309
-
310
-
311
-
312
-
313
-
314
-
315
-
316
-
317
-
318
-
319
-
320
-
321
-
322
-
323
-
324
-
325
-
326
-
327
-
328
-
329
-
330
-
331
-
332
-
333
-
334
-
335
-
336
-
337
-
338
-
339
-
340
-
341
-
342
 |
 |

76
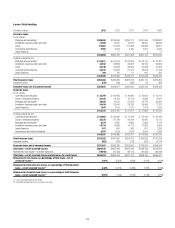
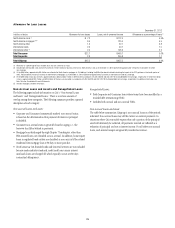
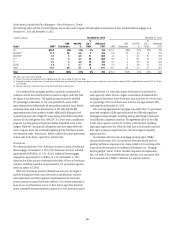
Details of Credit Loss Experience
In millions of dollars 2013 2012 2011 2010 2009
Allowance for loan losses at beginning of period $25,455 $30,115 $40,655 $36,033 $29,616
Provision for loan losses
Consumer (1)(2) $ 7,603 $10,371 $12,075 $24,886 $32,115
Corporate 187 (739) 75 6,353
$ 7,604 $10,458 $11,336 $24,961 $38,468
Gross credit losses
Consumer
In U.S. offices (1)(2) $ 8,402 $12,226 $15,767 $24,183 $17,637
In offices outside the U.S. 3,998 4,139 4,932 6,548 8,437
Corporate
Commercial and industrial, and other
In U.S. offices 125 154 392 1,222 3,299
In offices outside the U.S. 144 305 649 571 1,564
Loans to financial institutions
In U.S. offices 233 215 275 274
In offices outside the U.S. 768 391 111 448
Mortgage and real estate
In U.S. offices 62 59 182 953 592
In offices outside the U.S. 29 21 171 286 151
$12,769 $17,005 $22,699 $34,149 $32,402
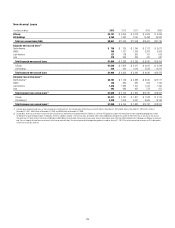
Credit recoveries
Consumer
In U.S. offices $ 1,073 $ 1,302 $ 1,467 $ 1,323 $ 576
In offices outside the U.S. 1,065 1,055 1,159 1,209 970
Corporate
Commercial & industrial, and other
In U.S. offices 62 243 175 591 276
In offices outside the U.S. 52 95 93 115 87
Loans to financial institutions
In U.S. offices 1— — — —
In offices outside the U.S. 20 43 89 132 11
Mortgage and real estate
In U.S. offices 31 17 27 130 3
In offices outside the U.S. 219 2 26 1
$ 2,306 $ 2,774 $ 3,012 $ 3,526 $ 1,924
Net credit losses
In U.S. offices (1)(2) $ 7,424 $10,910 $14,887 $24,589 $20,947
In offices outside the U.S. 3,039 3,321 4,800 6,034 9,531
Total $10,463 $14,231 $19,687 $30,623 $30,478
Other - net (3)(4)(5)(6)(7)(8) $ (2,948) $ (887) $ (2,189) 10,284 $ (1,573)
Allowance for loan losses at end of period $19,648 $25,455 $30,115 $40,655 $36,033
Allowance for loan losses as a % of total loans (9) 2.97% 3.92% 4.69% 6.31% 6.09%
Allowance for unfunded lending commitments (10) $ 1,229 $ 1,119 $ 1,136 $ 1,066 $ 1,157
Total allowance for loan losses and unfunded lending commitments $20,877 $26,574 $31,251 $41,721 $37,190
Net Consumer credit losses (1) $10,262 $14,008 $18,073 $28,199 $24,528
As a percentage of average Consumer loans 2.63% 3.43% 4.15% 5.72% 5.41%
Net Corporate credit losses $ 201 $ 223 $ 1,614 $ 2,424 $ 5,950
As a percentage of average Corporate loans 0.08% 0.09% 0.79% 1.27% 3.13%
Allowance for loan losses at end of period (11)
Citicorp $13,174 $14,623 $16,699 $22,366 $12,404
Citi Holdings 6,474 10,832 13,416 18,289 23,629
Total Citigroup $19,648 $25,455 $30,115 $40,655 $36,033
Allowance by type
Consumer $17,064 $22,679 $27,236 $35,406 $28,347
Corporate 2,584 2,776 2,879 5,249 7,686
Total Citigroup $19,648 $25,455 $30,115 $40,655 $36,033