Citibank 2013 Annual Report Download - page 107
Download and view the complete annual report
Please find page 107 of the 2013 Citibank annual report below. You can navigate through the pages in the report by either clicking on the pages listed below, or by using the keyword search tool below to find specific information within the annual report.-
 1
1 -
2
-
3
-
4
-
5
-
6
-
7
-
8
-
9
-
10
-
11
-
12
-
13
-
14
-
15
-
16
-
17
-
18
-
19
-
20
-
21
-
22
-
23
-
24
-
25
-
26
-
27
-
28
-
29
-
30
-
31
-
32
-
33
-
34
-
35
-
36
-
37
-
38
-
39
-
40
-
41
-
42
-
43
-
44
-
45
-
46
-
47
-
48
-
49
-
50
-
51
-
52
-
53
-
54
-
55
-
56
-
57
-
58
-
59
-
60
-
61
-
62
-
63
-
64
-
65
-
66
-
67
-
68
-
69
-
70
-
71
-
72
-
73
-
74
-
75
-
76
-
77
-
78
-
79
-
80
-
81
-
82
-
83
-
84
-
85
-
86
-
87
-
88
-
89
-
90
-
91
-
92
-
93
-
94
-
95
-
96
-
 97
97 -
 98
98 -
 99
99 -
 100
100 -
 101
101 -
 102
102 -
 103
103 -
 104
104 -
 105
105 -
 106
106 -
 107
107 -
 108
108 -
 109
109 -
 110
110 -
 111
111 -
 112
112 -
 113
113 -
 114
114 -
 115
115 -
 116
116 -
 117
117 -
118
-
119
-
120
-
121
-
122
-
123
-
124
-
125
-
126
-
127
-
128
-
129
-
130
-
131
-
132
-
133
-
134
-
135
-
136
-
137
-
138
-
139
-
140
-
141
-
142
-
143
-
144
-
145
-
146
-
147
-
148
-
149
-
150
-
151
-
152
-
153
-
154
-
155
-
156
-
157
-
158
-
159
-
160
-
161
-
162
-
163
-
164
-
165
-
166
-
167
-
168
-
169
-
170
-
171
-
172
-
173
-
174
-
175
-
176
-
177
-
178
-
179
-
180
-
181
-
182
-
183
-
184
-
185
-
186
-
187
-
188
-
189
-
190
-
191
-
192
-
193
-
194
-
195
-
196
-
197
-
198
-
199
-
200
-
201
-
202
-
203
-
204
-
205
-
206
-
207
-
208
-
209
-
210
-
211
-
212
-
213
-
214
-
215
-
216
-
217
-
218
-
219
-
220
-
221
-
222
-
223
-
224
-
225
-
226
-
227
-
228
-
229
-
230
-
231
-
232
-
233
-
234
-
235
-
236
-
237
-
238
-
239
-
240
-
241
-
242
-
243
-
244
-
245
-
246
-
247
-
248
-
249
-
250
-
251
-
252
-
253
-
254
-
255
-
256
-
257
-
258
-
259
-
260
-
261
-
262
-
263
-
264
-
265
-
266
-
267
-
268
-
269
-
270
-
271
-
272
-
273
-
274
-
275
-
276
-
277
-
278
-
279
-
280
-
281
-
282
-
283
-
284
-
285
-
286
-
287
-
288
-
289
-
290
-
291
-
292
-
293
-
294
-
295
-
296
-
297
-
298
-
299
-
300
-
301
-
302
-
303
-
304
-
305
-
306
-
307
-
308
-
309
-
310
-
311
-
312
-
313
-
314
-
315
-
316
-
317
-
318
-
319
-
320
-
321
-
322
-
323
-
324
-
325
-
326
-
327
-
328
-
329
-
330
-
331
-
332
-
333
-
334
-
335
-
336
-
337
-
338
-
339
-
340
-
341
-
342
 |
 |

89
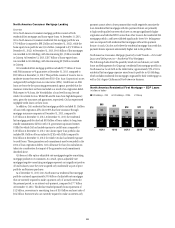
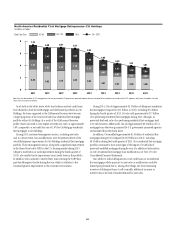
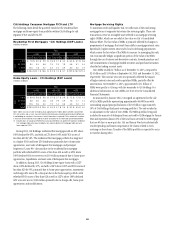
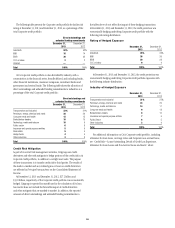
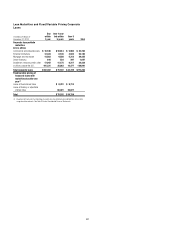
Citi Holdings Consumer Mortgage FICO and LTV
The following charts detail the quarterly trends for the residential first
mortgage and home equity loan portfolios within Citi Holdings by risk
segment (FICO and LTV/CLTV).
Residential First Mortgages - Citi Holdings (EOP Loans)
In billions of dollars
FICO
≥ 660 660-620 <620
4Q’11 4Q’12 4Q’13 4Q’11 4Q’12 4Q’13 4Q’11 4Q’12 4Q’13
LTV
< 80% $ 7.8 $ 8.0 $ 9.9 $ 2.6 $ 2.7 $ 3.0 $ 6.3 $ 6.1 $ 5.6
80-100% 8.0 8.4 6.6 2.3 2.3 1.8 5.6 5.1 3.4
> 100% 12.5 7. 2.2 3.2 2.2 0.9 8.0 5.0 2.2
Total(1) $ 28.3 $ 24.1 $ 18.6 $ 8.2 $ 7.3 $ 5.7 $ 19.9 $ 16.2 $ 11.3
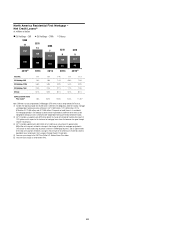
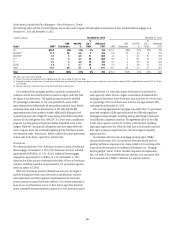
Home Equity Loans - Citi Holdings (EOP Loans)
In billions of dollars
FICO
≥ 660 660-620 <620
4Q’11 4Q’12 4Q’13 4Q’11 4Q’12 4Q’13 4Q’11 4Q’12 4Q’13
CLTV
< 80% $ 8.9 $ 8.6 $ 9.8 $ 0.7 $ 0.7 $ 0.9 $ 1.2 $ 1.2 $ 1.3
80-100% 6.8 6.0 5.8 0.8 0.9 0.9 1.6 1.7 1.4
> 100% 12.5 9.3 5.0 1.9 1.4 0.8 3.5 2.4 1.2
Total(1) $ 28.3 $ 23.9 $ 20.6 $ 3.5 $ 3.1 $ 2.6 $ 6.2 $ 5.3 $ 4.0
Notes: Tables may not sum due to rounding. Data appearing in the tables above have been sourced from
Citi’s risk systems and, as such, may not reconcile with disclosures elsewhere generally due to differences
in methodology or variations in the manner in which information is captured. Citi has noted such variations
in instances where it believes they could be material to reconcile to the information presented elsewhere.
(1) Excludes loans in Canada and Puerto Rico, loans guaranteed by U.S. government agencies (residential
first mortgages table only), loans recorded at fair value (residential first mortgages table only) and
loans subject to LTSCs.
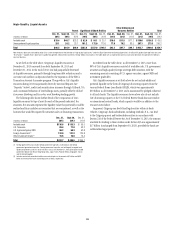
During 2013, Citi Holdings residential first mortgages with an LTV above
100% declined by 65%, and with an LTV above 100% with FICO scores of
less than 620 by 56%. The residential first mortgage portfolio has migrated
to a higher FICO and lower LTV distribution primarily due to home price
appreciation, asset sales of delinquent first mortgages and principal
forgiveness. Loans 90+ days past due in the residential first mortgage
portfolio with refreshed FICO scores of less than 620 as well as LTVs above
100% declined 64% year-over-year to $0.4 billion primarily due to home price
appreciation, liquidations and asset sales of delinquent first mortgages.
In addition, during 2013, Citi Holdings home equity loans with a CLTV
above 100% declined by 47%, and with a CLTV above 100% and FICO scores of
less than 620 by 50%, primarily due to home price appreciation, repayments
and charge-offs. Loans 90+ days past due in the home equity portfolio with
refreshed FICO scores of less than 620 as well as CLTVs above 100% declined
60% year-over-year to $130 million primarily due to charge-offs, home price
appreciation and modifications.
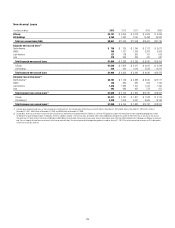
Mortgage Servicing Rights
To minimize credit and liquidity risk, Citi sells most of the conforming
mortgage loans it originates but retains the servicing rights. These sale
transactions create an intangible asset referred to as mortgage servicing
rights (MSRs), which are recorded at fair value on Citi’s Consolidated
Balance Sheet. The fair value of MSRs is primarily affected by changes in
prepayments of mortgages that result from shifts in mortgage interest rates.
Specifically, higher interest rates tend to lead to declining prepayments
which causes the fair value of the MSRs to increase. In managing this risk,
Citi economically hedges a significant portion of the value of its MSRs
through the use of interest rate derivative contracts, forward purchase and
sale commitments of mortgage-backed securities and purchased securities
classified as trading account assets.
Citi’s MSRs totaled $2.7 billion as of December 31, 2013, compared to
$2.6 billion and $1.9 billion at September 30, 2013 and December 31, 2012,
respectively. The increase year-over-year primarily reflected the impact
of higher interest rates and newly capitalized MSRs, partially offset by
amortization. At December 31, 2013, approximately $2.1 billion of
MSRs were specific to Citicorp, with the remainder to Citi Holdings. For
additional information on Citi’s MSRs, see Note 22 to the Consolidated
Financial Statements.
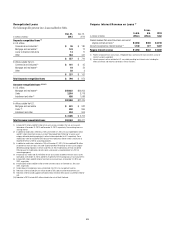
As announced in January 2014, Citi signed an agreement for the sale
of Citi’s MSRs portfolio representing approximately 64,000 loans with
outstanding unpaid principal balances of $10.3 billion (approximately
10% of Citi Holdings third-party servicing portfolio). The sale resulted in
no adjustment to the value of Citi’s MSRs. The MSRs portfolio being sold
includes the majority of delinquent loans serviced by CitiMortgage for Fannie
Mae and represents almost 20% of the total loans serviced by CitiMortgage
that are 60 days or more past due. Citi and Fannie Mae have substantially
resolved pending and future compensatory fee claims related to Citi’s
servicing on those loans. Transfer of the MSRs portfolio is expected to occur
in tranches during 2014.
8