Citibank 2013 Annual Report Download - page 27
Download and view the complete annual report
Please find page 27 of the 2013 Citibank annual report below. You can navigate through the pages in the report by either clicking on the pages listed below, or by using the keyword search tool below to find specific information within the annual report.-
 1
1 -
2
-
3
-
4
-
5
-
6
-
7
-
8
-
9
-
10
-
11
-
12
-
13
-
14
-
15
-
16
-
 17
17 -
 18
18 -
 19
19 -
 20
20 -
 21
21 -
 22
22 -
 23
23 -
 24
24 -
 25
25 -
 26
26 -
 27
27 -
 28
28 -
 29
29 -
 30
30 -
 31
31 -
 32
32 -
 33
33 -
 34
34 -
 35
35 -
 36
36 -
 37
37 -
38
-
39
-
40
-
41
-
42
-
43
-
44
-
45
-
46
-
47
-
48
-
49
-
50
-
51
-
52
-
53
-
54
-
55
-
56
-
57
-
58
-
59
-
60
-
61
-
62
-
63
-
64
-
65
-
66
-
67
-
68
-
69
-
70
-
71
-
72
-
73
-
74
-
75
-
76
-
77
-
78
-
79
-
80
-
81
-
82
-
83
-
84
-
85
-
86
-
87
-
88
-
89
-
90
-
91
-
92
-
93
-
94
-
95
-
96
-
97
-
98
-
99
-
100
-
101
-
102
-
103
-
104
-
105
-
106
-
107
-
108
-
109
-
110
-
111
-
112
-
113
-
114
-
115
-
116
-
117
-
118
-
119
-
120
-
121
-
122
-
123
-
124
-
125
-
126
-
127
-
128
-
129
-
130
-
131
-
132
-
133
-
134
-
135
-
136
-
137
-
138
-
139
-
140
-
141
-
142
-
143
-
144
-
145
-
146
-
147
-
148
-
149
-
150
-
151
-
152
-
153
-
154
-
155
-
156
-
157
-
158
-
159
-
160
-
161
-
162
-
163
-
164
-
165
-
166
-
167
-
168
-
169
-
170
-
171
-
172
-
173
-
174
-
175
-
176
-
177
-
178
-
179
-
180
-
181
-
182
-
183
-
184
-
185
-
186
-
187
-
188
-
189
-
190
-
191
-
192
-
193
-
194
-
195
-
196
-
197
-
198
-
199
-
200
-
201
-
202
-
203
-
204
-
205
-
206
-
207
-
208
-
209
-
210
-
211
-
212
-
213
-
214
-
215
-
216
-
217
-
218
-
219
-
220
-
221
-
222
-
223
-
224
-
225
-
226
-
227
-
228
-
229
-
230
-
231
-
232
-
233
-
234
-
235
-
236
-
237
-
238
-
239
-
240
-
241
-
242
-
243
-
244
-
245
-
246
-
247
-
248
-
249
-
250
-
251
-
252
-
253
-
254
-
255
-
256
-
257
-
258
-
259
-
260
-
261
-
262
-
263
-
264
-
265
-
266
-
267
-
268
-
269
-
270
-
271
-
272
-
273
-
274
-
275
-
276
-
277
-
278
-
279
-
280
-
281
-
282
-
283
-
284
-
285
-
286
-
287
-
288
-
289
-
290
-
291
-
292
-
293
-
294
-
295
-
296
-
297
-
298
-
299
-
300
-
301
-
302
-
303
-
304
-
305
-
306
-
307
-
308
-
309
-
310
-
311
-
312
-
313
-
314
-
315
-
316
-
317
-
318
-
319
-
320
-
321
-
322
-
323
-
324
-
325
-
326
-
327
-
328
-
329
-
330
-
331
-
332
-
333
-
334
-
335
-
336
-
337
-
338
-
339
-
340
-
341
-
342
 |
 |
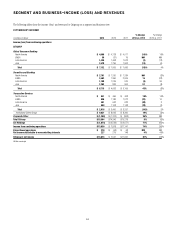
9
Citi Holdings
Citi Holdings’ net loss was $1.9 billion in 2013 compared to a $6.5 billion net
loss in 2012. The decline in the net loss year-over-year was primarily driven
by the absence of the 2012 pretax loss of $4.7 billion ($2.9 billion after-tax)
related to the Morgan Stanley Smith Barney joint venture (MSSB). Excluding
the 2012 MSSB loss, $77 million ($49 million after-tax) of repositioning
charges in the fourth quarter 2012 and CVA/DVA (positive $3 million in
2013 compared to positive $157 million in 2012), Citi Holdings net loss
of $1.9 billion in 2013 improved 49% from a net loss of $3.7 billion in the
prior year. The improvement in the net loss was due to significantly lower
provisions for credit losses and higher revenue, partially offset by the increase
in expenses driven by higher legal and related costs, as discussed above.
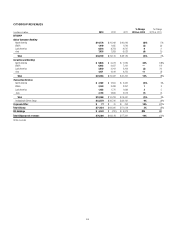
Citi Holdings revenues increased to $4.5 billion, compared to a negative
$792 million in the prior year. Excluding the 2012 MSSB loss and CVA/DVA,
Citi Holdings revenues were $4.5 billion in 2013 compared to $3.7 billion
in the prior year. Net interest revenues increased 22% year-over-year to
$3.2 billion, largely driven by lower funding costs. Non-interest revenues,
excluding the 2012 MSSB loss and CVA/DVA, increased 21% to $1.4 billion,
primarily driven by lower asset marks and the lower repurchase reserve
builds, partially offset by lower consumer revenues and gains on asset sales.
Citi Holdings assets declined 25% year-over-year to $117 billion as of
year-end 2013, and represented approximately 6% of total Citi’s GAAP assets
and 19% of its estimated risk-weighted assets under Basel III (based on the
“Advanced Approaches” for determining risk-weighted assets).