Citibank 2013 Annual Report Download - page 234
Download and view the complete annual report
Please find page 234 of the 2013 Citibank annual report below. You can navigate through the pages in the report by either clicking on the pages listed below, or by using the keyword search tool below to find specific information within the annual report.-
 1
1 -
2
-
3
-
4
-
5
-
6
-
7
-
8
-
9
-
10
-
11
-
12
-
13
-
14
-
15
-
16
-
17
-
18
-
19
-
20
-
21
-
22
-
23
-
24
-
25
-
26
-
27
-
28
-
29
-
30
-
31
-
32
-
33
-
34
-
35
-
36
-
37
-
38
-
39
-
40
-
41
-
42
-
43
-
44
-
45
-
46
-
47
-
48
-
49
-
50
-
51
-
52
-
53
-
54
-
55
-
56
-
57
-
58
-
59
-
60
-
61
-
62
-
63
-
64
-
65
-
66
-
67
-
68
-
69
-
70
-
71
-
72
-
73
-
74
-
75
-
76
-
77
-
78
-
79
-
80
-
81
-
82
-
83
-
84
-
85
-
86
-
87
-
88
-
89
-
90
-
91
-
92
-
93
-
94
-
95
-
96
-
97
-
98
-
99
-
100
-
101
-
102
-
103
-
104
-
105
-
106
-
107
-
108
-
109
-
110
-
111
-
112
-
113
-
114
-
115
-
116
-
117
-
118
-
119
-
120
-
121
-
122
-
123
-
124
-
125
-
126
-
127
-
128
-
129
-
130
-
131
-
132
-
133
-
134
-
135
-
136
-
137
-
138
-
139
-
140
-
141
-
142
-
143
-
144
-
145
-
146
-
147
-
148
-
149
-
150
-
151
-
152
-
153
-
154
-
155
-
156
-
157
-
158
-
159
-
160
-
161
-
162
-
163
-
164
-
165
-
166
-
167
-
168
-
169
-
170
-
171
-
172
-
173
-
174
-
175
-
176
-
177
-
178
-
179
-
180
-
181
-
182
-
183
-
184
-
185
-
186
-
187
-
188
-
189
-
190
-
191
-
192
-
193
-
194
-
195
-
196
-
197
-
198
-
199
-
200
-
201
-
202
-
203
-
204
-
205
-
206
-
207
-
208
-
209
-
210
-
211
-
212
-
213
-
214
-
215
-
216
-
217
-
218
-
219
-
220
-
221
-
222
-
223
-
 224
224 -
 225
225 -
 226
226 -
 227
227 -
 228
228 -
 229
229 -
 230
230 -
 231
231 -
 232
232 -
 233
233 -
 234
234 -
 235
235 -
 236
236 -
 237
237 -
 238
238 -
 239
239 -
 240
240 -
 241
241 -
 242
242 -
 243
243 -
 244
244 -
245
-
246
-
247
-
248
-
249
-
250
-
251
-
252
-
253
-
254
-
255
-
256
-
257
-
258
-
259
-
260
-
261
-
262
-
263
-
264
-
265
-
266
-
267
-
268
-
269
-
270
-
271
-
272
-
273
-
274
-
275
-
276
-
277
-
278
-
279
-
280
-
281
-
282
-
283
-
284
-
285
-
286
-
287
-
288
-
289
-
290
-
291
-
292
-
293
-
294
-
295
-
296
-
297
-
298
-
299
-
300
-
301
-
302
-
303
-
304
-
305
-
306
-
307
-
308
-
309
-
310
-
311
-
312
-
313
-
314
-
315
-
316
-
317
-
318
-
319
-
320
-
321
-
322
-
323
-
324
-
325
-
326
-
327
-
328
-
329
-
330
-
331
-
332
-
333
-
334
-
335
-
336
-
337
-
338
-
339
-
340
-
341
-
342
 |
 |

216
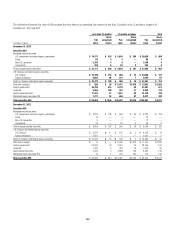
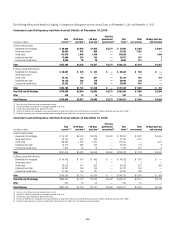
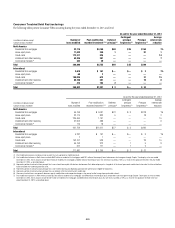
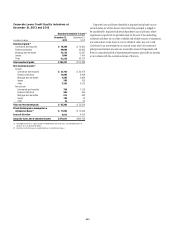
The following tables provide details on Citigroup’s Consumer loan delinquency and non-accrual loans as of December 31, 2013 and December 31, 2012:
Consumer Loan Delinquency and Non-Accrual Details at December 31, 2013
In millions of dollars
Total
current (1)(2)
30-89 days
past due (3) ≥ 90 days
past due (3)
Past due
government
guaranteed (4)
Total
loans (2)
Total
non-accrual
90 days past due
and accruing
In North America offices
Residential first mortgages $ 66,666 $ 2,040 $ 1,925 $5,271 $ 75,902 $ 3,369 $ 3,997
Home equity loans (5) 30,603 434 605 — 31,642 1,452 —
Credit cards 113,878 1,495 1,456 — 116,829 — 1,456
Installment and other 12,609 225 243 — 13,077 247 7
Commercial market loans 8,630 26 28 — 8,684 112 7
Total $232,386 $ 4,220 $ 4,257 $ 5,271 $246,134 $ 5,180 $5,467
In offices outside North America
Residential first mortgages $ 46,067 $ 435 $ 332 $ — $ 46,834 $ 584 $ —
Home equity loans (5) — — — — — — —
Credit cards 34,733 780 641 — 36,154 402 413
Installment and other 30,138 398 158 — 30,694 230 —
Commercial market loans 33,242 111 295 — 33,648 610 —
Total $144,180 $ 1,724 $ 1,426 $ — $147,330 $ 1,826 $ 413
Total GCB and Citi Holdings $376,566 $ 5,944 $ 5,683 $ 5,271 $393,464 $ 7,006 $ 5,880
Other 338 13 16 — 367 43 —
Total Citigroup $376,904 $5,957 $5,699 $ 5,271 $393,831 $ 7,049 $ 5,880
(1) Loans less than 30 days past due are presented as current.
(2) Includes $0.9 billion of residential first mortgages recorded at fair value.
(3) Excludes loans guaranteed by U.S. government entities.
(4) Consists of residential first mortgages that are guaranteed by U.S. government entities that are 30-89 days past due of $1.2 billion and 90 days past due of $4.1 billion.
(5) Fixed rate home equity loans and loans extended under home equity lines of credit, which are typically in junior lien positions.
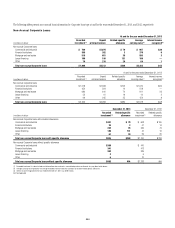
Consumer Loan Delinquency and Non-Accrual Details at December 31, 2012
In millions of dollars
Total
current (1)(2)
30-89 days
past due (3) ≥ 90 days
past due (3)
Past due
government
guaranteed (4)
Total
loans (2)
Total
non-accrual
90 days past due
and accruing
In North America offices
Residential first mortgages $ 75,791 $ 3,074 $3,339 $ 6,000 $ 88,204 $ 4,922 $4,695
Home equity loans (5) 35,740 642 843 — 37,225 1,797 —
Credit cards 108,892 1,582 1,527 — 112,001 — 1,527
Installment and other 13,319 288 325 — 13,932 179 8
Commercial market loans 7,874 32 19 — 7,925 210 11
Total $241,616 $ 5,618 $ 6,053 $ 6,000 $259,287 $ 7,108 $ 6,241
In offices outside North America
Residential first mortgages $ 45,496 $ 547 $ 485 $ — $ 46,528 $ 807 $ —
Home equity loans (5) 4 — 2 — 6 2 —
Credit cards 38,920 970 805 — 40,695 516 508
Installment and other 29,351 496 166 — 30,013 254 —
Commercial market loans 31,263 106 181 — 31,550 428 —
Total $145,034 $ 2,119 $ 1,639 $ — $148,792 $ 2,007 $ 508
Total GCB and Citi Holdings $386,650 $ 7,737 $ 7,692 $ 6,000 $408,079 $ 9,115 $ 6,749
Other 545 18 29 — 592 81 —
Total Citigroup $387,195 $ 7,755 $ 7,721 $ 6,000 $408,671 $ 9,196 $ 6,749
(1) Loans less than 30 days past due are presented as current.
(2) Includes $1.2 billion of residential first mortgages recorded at fair value.
(3) Excludes loans guaranteed by U.S. government entities.
(4) Consists of residential first mortgages that are guaranteed by U.S. government entities that are 30-89 days past due of $1.3 billion and 90 days past due of $4.7 billion.
(5) Fixed rate home equity loans and loans extended under home equity lines of credit, which are typically in junior lien positions.