Citibank 2010 Annual Report Download - page 99
Download and view the complete annual report
Please find page 99 of the 2010 Citibank annual report below. You can navigate through the pages in the report by either clicking on the pages listed below, or by using the keyword search tool below to find specific information within the annual report.-
 1
1 -
2
-
3
-
4
-
5
-
6
-
7
-
8
-
9
-
10
-
11
-
12
-
13
-
14
-
15
-
16
-
17
-
18
-
19
-
20
-
21
-
22
-
23
-
24
-
25
-
26
-
27
-
28
-
29
-
30
-
31
-
32
-
33
-
34
-
35
-
36
-
37
-
38
-
39
-
40
-
41
-
42
-
43
-
44
-
45
-
46
-
47
-
48
-
49
-
50
-
51
-
52
-
53
-
54
-
55
-
56
-
57
-
58
-
59
-
60
-
61
-
62
-
63
-
64
-
65
-
66
-
67
-
68
-
69
-
70
-
71
-
72
-
73
-
74
-
75
-
76
-
77
-
78
-
79
-
80
-
81
-
82
-
83
-
84
-
85
-
86
-
87
-
88
-
 89
89 -
 90
90 -
 91
91 -
 92
92 -
 93
93 -
 94
94 -
 95
95 -
 96
96 -
 97
97 -
 98
98 -
 99
99 -
 100
100 -
 101
101 -
 102
102 -
 103
103 -
 104
104 -
 105
105 -
 106
106 -
 107
107 -
 108
108 -
 109
109 -
110
-
111
-
112
-
113
-
114
-
115
-
116
-
117
-
118
-
119
-
120
-
121
-
122
-
123
-
124
-
125
-
126
-
127
-
128
-
129
-
130
-
131
-
132
-
133
-
134
-
135
-
136
-
137
-
138
-
139
-
140
-
141
-
142
-
143
-
144
-
145
-
146
-
147
-
148
-
149
-
150
-
151
-
152
-
153
-
154
-
155
-
156
-
157
-
158
-
159
-
160
-
161
-
162
-
163
-
164
-
165
-
166
-
167
-
168
-
169
-
170
-
171
-
172
-
173
-
174
-
175
-
176
-
177
-
178
-
179
-
180
-
181
-
182
-
183
-
184
-
185
-
186
-
187
-
188
-
189
-
190
-
191
-
192
-
193
-
194
-
195
-
196
-
197
-
198
-
199
-
200
-
201
-
202
-
203
-
204
-
205
-
206
-
207
-
208
-
209
-
210
-
211
-
212
-
213
-
214
-
215
-
216
-
217
-
218
-
219
-
220
-
221
-
222
-
223
-
224
-
225
-
226
-
227
-
228
-
229
-
230
-
231
-
232
-
233
-
234
-
235
-
236
-
237
-
238
-
239
-
240
-
241
-
242
-
243
-
244
-
245
-
246
-
247
-
248
-
249
-
250
-
251
-
252
-
253
-
254
-
255
-
256
-
257
-
258
-
259
-
260
-
261
-
262
-
263
-
264
-
265
-
266
-
267
-
268
-
269
-
270
-
271
-
272
-
273
-
274
-
275
-
276
-
277
-
278
-
279
-
280
-
281
-
282
-
283
-
284
-
285
-
286
-
287
-
288
-
289
-
290
-
291
-
292
-
293
-
294
-
295
-
296
-
297
-
298
-
299
-
300
-
301
-
302
-
303
-
304
-
305
-
306
-
307
-
308
-
309
-
310
-
311
-
312
 |
 |
97
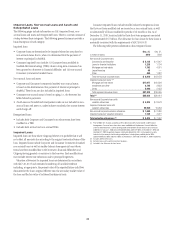
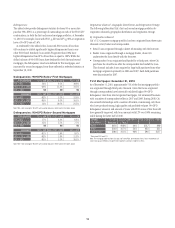
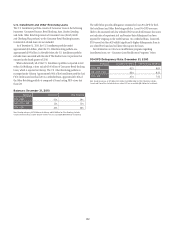
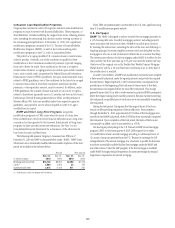
Second Mortgages: December 31, 2010
For second mortgages, approximately 46% of the loans were originated
through third-party channels. As these mortgages have demonstrated
a higher incidence of delinquencies, Citi no longer originates second
mortgages through third-party channels. 90+DPD delinquency amounts,
amount of loans with FICO scores of less than 620, and amount of loans with
LTV over 100% were relatively stable during the latter half of 2010.
CHANNEL
($ in billions)
Second Lien
Mortgages
Channel
% Total
90+DPD % *FICO < 620 *LTV > 100%
Retail $22.5 53.5% 2.0% $3.5 $6.8
Broker $10.3 24.5% 3.7% $1.7 $6.3
Correspondent $9.2 22.0% 3.8% $2.1 $6.9
* Refreshed FICO and LTV.
Note: Excludes Canada and Puerto Rico, deferred fees/costs and loans subject to LTSCs.
By State
Approximately half of Citi’s U.S. Consumer mortgage portfolio is located
in five states: California, New York, Florida, Illinois and Texas. These states
represent 50% of first mortgages and 55% of second mortgages.
With respect to first mortgages, Florida and Illinois had above average
90+DPD delinquency rates as of December 31, 2010. Florida has 56% of
its first mortgage portfolio with refreshed LTV > 100%, compared to 30%
overall for first mortgages. Illinois has 42% of its loan portfolio with refreshed
LTV > 100%. Texas, despite having 40% of its portfolio with FICO < 620, had
a lower delinquency rate relative to the overall portfolio. Texas had 5% of its
loan portfolio with refreshed LTV > 100%.
In the second mortgage portfolio, Florida continued to experience above-
average delinquencies at 4.4% as of December 31, 2010, with approximately
73% of its loans with refreshed LTV > 100%, compared to 48% overall for
second mortgages.
By Vintage
For Citigroup’s combined U.S. Consumer mortgage portfolio (first and
second mortgages), as of December 31, 2010, approximately half of the
portfolio consisted of 2006 and 2007 vintages, which demonstrate above
average delinquencies. In first mortgages, approximately 41% of the portfolio
is of 2006 and 2007 vintages, which had 90+DPD rates well above the overall
portfolio rate, at 8.0% for 2006 and 8.8% for 2007. In second mortgages,
61% of the portfolio is of 2006 and 2007 vintages, which again had higher
delinquencies compared to the overall portfolio rate, at 3.4% for 2006 and
3.3% for 2007.
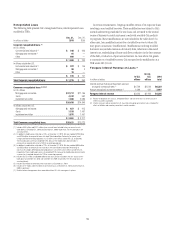
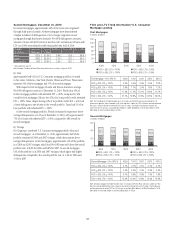
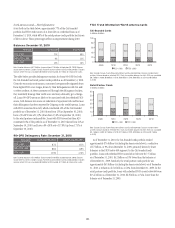
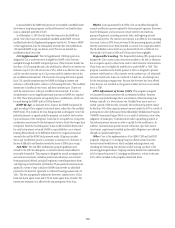
FICO and LTV Trend Information—U.S. Consumer
Mortgage Lending
First Mortgages
In billions of dollars
14.9 13.9 14.2 13.2 12.6
27.5 27.0 23.9 23.1 21.3
14.9 14.8 14.4
48.9 45.0 42.6 41.7 40.3
0
20
40
60
80
100
120
4Q09 1Q10 2Q10 3Q10 4Q10
FICO < 660, LTV > 100% FICO < 660, LTV ≤ 100%
FICO ≥ 660, LTV > 100% FICO ≥ 660, LTV ≤ 100%
15.0 13.5
First Mortgage—90+ DPD % 4Q09 1Q10 2Q10 3Q10 4Q10
FICO > 660, LTV < 100% 0.5% 0.4% 0.5% 0.4% 0.3%
FICO > 660, LTV > 100% 2.8% 1.7% 2.0% 1.8% 1.2%
FICO < 660, LTV < 100% 17.9% 17.2% 15.1% 14.6% 12.7%
FICO < 660, LTV > 100% 37.7% 32.8% 26.8% 24.3% 20.3%
Note: First mortgage chart/table excludes loans in Canada and Puerto Rico, loans guaranteed by U.S.
government agencies, loans recorded at fair value and loans subject to LTSCs. Balances excludes deferred
fees/costs. Balances based on refreshed FICO and LTV ratios. Chart/table also excludes balances for
which FICO or LTV data was unavailable ($1.0 billion in 4Q09, $0.6 billion in 1Q10, $0.4 billion in 2Q10,
$0.4 billion in 3Q10 and $0.4 billion in 4Q10).
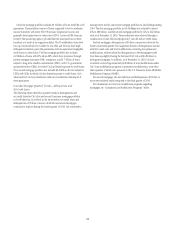
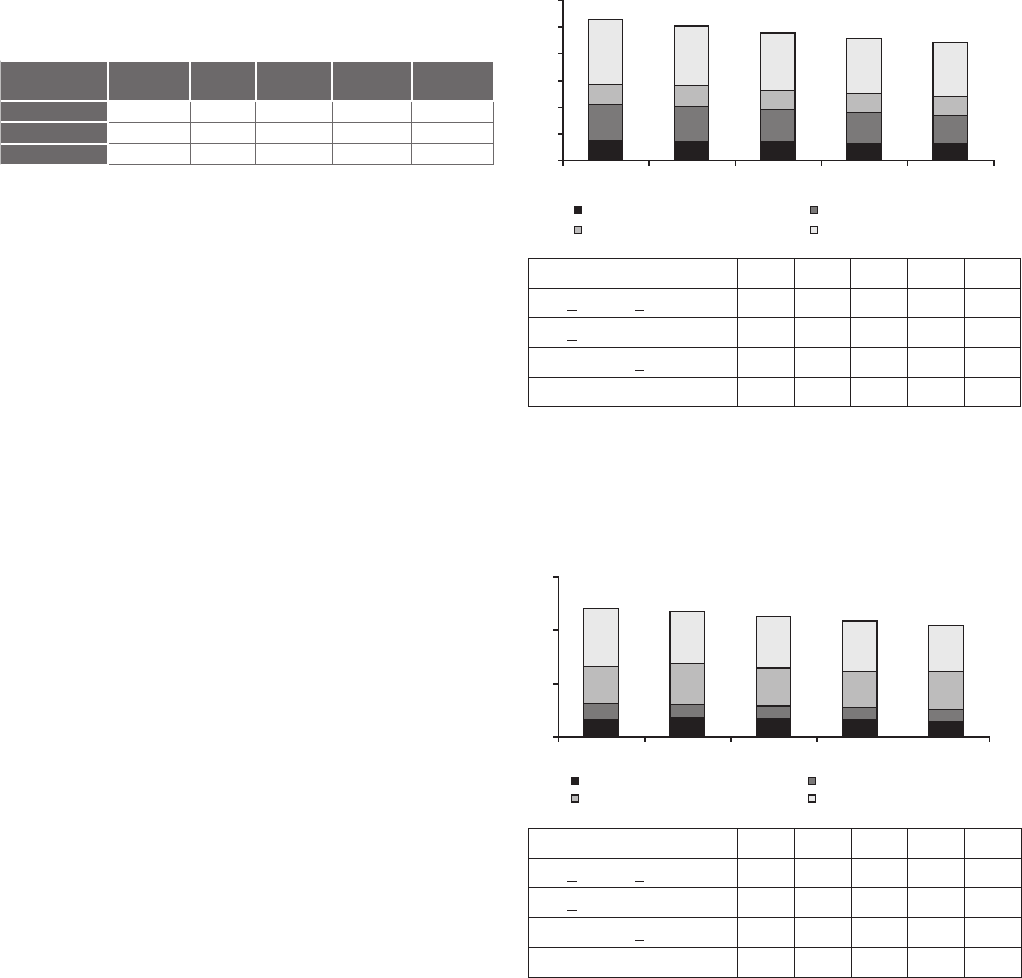
Second Mortgages
In billions of dollars
6.7 7.2 6.8 6.4 6.1
5.8 5.0 4.7 4.6 4.4
13.9 15.7 14.5 13.7 13.9
22.1 19.2 19.2 18.9 17.3
0
20
40
60
4Q09 1Q10 2Q10 3Q10 4Q10
FICO < 660, LTV > 100% FICO < 660, LTV ≤ 100%
FICO ≥ 660, LTV > 100% FICO ≥ 660, LTV ≤ 100%
Second Mortgage—90+ DPD % 4Q09 1Q10 2Q10 3Q10 4Q10
FICO > 660, LTV < 100% 0.1% 0.1% 0.1% 0.1% 0.1%
FICO > 660, LTV > 100% 0.4% 0.4% 0.4% 0.3% 0.3%
FICO < 660, LTV < 100% 6.7% 6.6% 6.6% 7.3% 7.8%
FICO < 660, LTV > 100% 15.4% 13.2% 12.8% 12.3% 12.3%
Note: Second mortgage chart/table excludes loans in Canada and Puerto Rico, and loans subject to LTSCs.
Balances exclude deferred fees/costs. Balances based on refreshed FICO and LTV ratios. Chart/table also
excludes balances for which FICO or LTV data was unavailable ($0.8 billion in 4Q09, $0.4 billion in 1Q10,
$0.4 billion in 2Q10, $0.4 billion in 3Q10 and $0.3 billion in 4Q10).