Citibank 2010 Annual Report Download - page 5
Download and view the complete annual report
Please find page 5 of the 2010 Citibank annual report below. You can navigate through the pages in the report by either clicking on the pages listed below, or by using the keyword search tool below to find specific information within the annual report.-
 1
1 -
 2
2 -
 3
3 -
 4
4 -
 5
5 -
 6
6 -
 7
7 -
 8
8 -
 9
9 -
 10
10 -
 11
11 -
 12
12 -
 13
13 -
 14
14 -
 15
15 -
 16
16 -
17
-
18
-
19
-
20
-
21
-
22
-
23
-
24
-
25
-
26
-
27
-
28
-
29
-
30
-
31
-
32
-
33
-
34
-
35
-
36
-
37
-
38
-
39
-
40
-
41
-
42
-
43
-
44
-
45
-
46
-
47
-
48
-
49
-
50
-
51
-
52
-
53
-
54
-
55
-
56
-
57
-
58
-
59
-
60
-
61
-
62
-
63
-
64
-
65
-
66
-
67
-
68
-
69
-
70
-
71
-
72
-
73
-
74
-
75
-
76
-
77
-
78
-
79
-
80
-
81
-
82
-
83
-
84
-
85
-
86
-
87
-
88
-
89
-
90
-
91
-
92
-
93
-
94
-
95
-
96
-
97
-
98
-
99
-
100
-
101
-
102
-
103
-
104
-
105
-
106
-
107
-
108
-
109
-
110
-
111
-
112
-
113
-
114
-
115
-
116
-
117
-
118
-
119
-
120
-
121
-
122
-
123
-
124
-
125
-
126
-
127
-
128
-
129
-
130
-
131
-
132
-
133
-
134
-
135
-
136
-
137
-
138
-
139
-
140
-
141
-
142
-
143
-
144
-
145
-
146
-
147
-
148
-
149
-
150
-
151
-
152
-
153
-
154
-
155
-
156
-
157
-
158
-
159
-
160
-
161
-
162
-
163
-
164
-
165
-
166
-
167
-
168
-
169
-
170
-
171
-
172
-
173
-
174
-
175
-
176
-
177
-
178
-
179
-
180
-
181
-
182
-
183
-
184
-
185
-
186
-
187
-
188
-
189
-
190
-
191
-
192
-
193
-
194
-
195
-
196
-
197
-
198
-
199
-
200
-
201
-
202
-
203
-
204
-
205
-
206
-
207
-
208
-
209
-
210
-
211
-
212
-
213
-
214
-
215
-
216
-
217
-
218
-
219
-
220
-
221
-
222
-
223
-
224
-
225
-
226
-
227
-
228
-
229
-
230
-
231
-
232
-
233
-
234
-
235
-
236
-
237
-
238
-
239
-
240
-
241
-
242
-
243
-
244
-
245
-
246
-
247
-
248
-
249
-
250
-
251
-
252
-
253
-
254
-
255
-
256
-
257
-
258
-
259
-
260
-
261
-
262
-
263
-
264
-
265
-
266
-
267
-
268
-
269
-
270
-
271
-
272
-
273
-
274
-
275
-
276
-
277
-
278
-
279
-
280
-
281
-
282
-
283
-
284
-
285
-
286
-
287
-
288
-
289
-
290
-
291
-
292
-
293
-
294
-
295
-
296
-
297
-
298
-
299
-
300
-
301
-
302
-
303
-
304
-
305
-
306
-
307
-
308
-
309
-
310
-
311
-
312
 |
 |

3
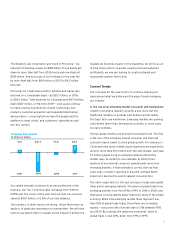
The Student Loan Corporation and much of Primerica — we
reduced Citi Holdings assets by $128 billion. Those assets are
down by more than half from 2008 levels and now stand at
$359 billion. And net losses in Citi Holdings for the year fell
by more than half, from $8.9 billion in 2009 to $4.2 billion
last year.
Provisions for credit losses and for benefits and claims also
declined on a comparable basis — by $25.7 billion, or 50%,
to $26.0 billion. Total expenses for Citigroup were $47.4 billion,
down $447 million, or 1%, from 2009 — even as we continue
to make ongoing investments in talent, technology, new
products, customer acquisition and expanded distribution,
among others — ensuring that we have the people and the
platform to meet clients’ and customers’ expectations well
into this century.
Our capital strength continues to be among the best in the
business. Our Tier 1 Common ratio increased from 9.6% to
10.8% over the course of the year. And our loan loss reserves
stand at $40.7 billion, or 6.3% of our loan balances.
The numbers, in other words, are strong. I know that return on
equity is of particular importance to shareholders. We will have
more to say about return on equity as the impact of all the new
regulations becomes clearer. In the meantime, we will focus on
driving strong return on assets. Having achieved sustained
profitability, we now are looking to create sustained and
responsible growth. Here’s how.
Current Trends
Our core goal for the near term is to continue aligning our
bank around what we believe are the major trends reshaping
our industry.
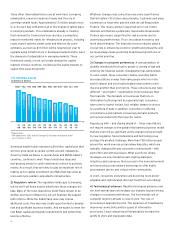
1) The rise of an emerging-market consumer and trading bloc:
Growth in emerging markets is hardly a new story, but the
traditional narrative is perhaps a bit behind current reality.
The basic facts are well-known. Emerging markets are growing
consistently faster than developed economies, in some cases
by many multiples.
Yet two deeper factors are driving this broader trend. The first
is the rise of the emerging-market consumer and that new
consumer base’s power to drive global growth. For example, in
China and India alone, middle class households are expected to
grow by more than 300 million over the next decade. Last year,
70 million people living in emerging markets entered the
middle class. According to one estimate, by 2020, three-
quarters of incremental consumer spending will come from
emerging markets. If that estimate is correct, then by that
same year, consumer spending in Asia will overtake North
America to become the world’s largest consumer bloc.
The other major factor is the vast increase in trade and capital
flows within emerging markets. The share of global trade from
emerging markets rose from 21% in 1995 to 35% in 2009, and
that share is rising slightly faster than their share of the global
economy. While intra-emerging market flows represent less
than 15% of global trade today, these flows are increasing
rapidly — rising from 6% of world trade to 13% between 1995
and 2009. By contrast, the advanced economies’ share of
global trade is now 65%, down from 79% in 1995.
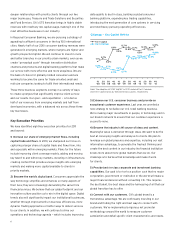
Citigroup Net Income
(in billions of dollars)
2008 20102007 2009
$3.6 $(1.6)$(27.7) $10.6