Citibank 2010 Annual Report Download - page 54
Download and view the complete annual report
Please find page 54 of the 2010 Citibank annual report below. You can navigate through the pages in the report by either clicking on the pages listed below, or by using the keyword search tool below to find specific information within the annual report.-
 1
1 -
2
-
3
-
4
-
5
-
6
-
7
-
8
-
9
-
10
-
11
-
12
-
13
-
14
-
15
-
16
-
17
-
18
-
19
-
20
-
21
-
22
-
23
-
24
-
25
-
26
-
27
-
28
-
29
-
30
-
31
-
32
-
33
-
34
-
35
-
36
-
37
-
38
-
39
-
40
-
41
-
42
-
43
-
 44
44 -
 45
45 -
 46
46 -
 47
47 -
 48
48 -
 49
49 -
 50
50 -
 51
51 -
 52
52 -
 53
53 -
 54
54 -
 55
55 -
 56
56 -
 57
57 -
 58
58 -
 59
59 -
 60
60 -
 61
61 -
 62
62 -
 63
63 -
 64
64 -
65
-
66
-
67
-
68
-
69
-
70
-
71
-
72
-
73
-
74
-
75
-
76
-
77
-
78
-
79
-
80
-
81
-
82
-
83
-
84
-
85
-
86
-
87
-
88
-
89
-
90
-
91
-
92
-
93
-
94
-
95
-
96
-
97
-
98
-
99
-
100
-
101
-
102
-
103
-
104
-
105
-
106
-
107
-
108
-
109
-
110
-
111
-
112
-
113
-
114
-
115
-
116
-
117
-
118
-
119
-
120
-
121
-
122
-
123
-
124
-
125
-
126
-
127
-
128
-
129
-
130
-
131
-
132
-
133
-
134
-
135
-
136
-
137
-
138
-
139
-
140
-
141
-
142
-
143
-
144
-
145
-
146
-
147
-
148
-
149
-
150
-
151
-
152
-
153
-
154
-
155
-
156
-
157
-
158
-
159
-
160
-
161
-
162
-
163
-
164
-
165
-
166
-
167
-
168
-
169
-
170
-
171
-
172
-
173
-
174
-
175
-
176
-
177
-
178
-
179
-
180
-
181
-
182
-
183
-
184
-
185
-
186
-
187
-
188
-
189
-
190
-
191
-
192
-
193
-
194
-
195
-
196
-
197
-
198
-
199
-
200
-
201
-
202
-
203
-
204
-
205
-
206
-
207
-
208
-
209
-
210
-
211
-
212
-
213
-
214
-
215
-
216
-
217
-
218
-
219
-
220
-
221
-
222
-
223
-
224
-
225
-
226
-
227
-
228
-
229
-
230
-
231
-
232
-
233
-
234
-
235
-
236
-
237
-
238
-
239
-
240
-
241
-
242
-
243
-
244
-
245
-
246
-
247
-
248
-
249
-
250
-
251
-
252
-
253
-
254
-
255
-
256
-
257
-
258
-
259
-
260
-
261
-
262
-
263
-
264
-
265
-
266
-
267
-
268
-
269
-
270
-
271
-
272
-
273
-
274
-
275
-
276
-
277
-
278
-
279
-
280
-
281
-
282
-
283
-
284
-
285
-
286
-
287
-
288
-
289
-
290
-
291
-
292
-
293
-
294
-
295
-
296
-
297
-
298
-
299
-
300
-
301
-
302
-
303
-
304
-
305
-
306
-
307
-
308
-
309
-
310
-
311
-
312
 |
 |

52
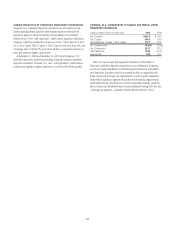
Items Impacting SAP Revenues
The table below provides additional information regarding the net revenue
marks affecting SAP during 2010 and 2009.
Pretax revenue
In millions of dollars 2010 2009
Subprime-related direct exposures (1) $1,994 $ 810
Private equity and equity investments 414 (1,128)
Alt-A mortgages (2)(3) (457) (1,451)
Highly leveraged loans and financing commitments (4) 20 (521)
Commercial real estate positions (2)(5) (447) (804)
Structured investment vehicles’ (SIVs) assets (179) (80)
ARS proprietary positions (6) 239 (23)
CVA related to exposure to monoline insurers 522 (1,301)
CVA on Citi debt liabilities under fair value option (10) (252)
CVA on derivatives positions, excluding monoline insurers (2) (60) 172
Subtotal $2,036 $(4,578)
Accretion on reclassified assets (7) 1,329 1,994
Total selected revenue items $3,365 $(2,584)
(1) Net of impact from hedges against direct subprime asset-backed security (ABS) CDO super senior
positions.
(2) Net of hedges.
(3) For these purposes, Alt-A mortgage securities are non-agency residential MBS (RMBS) where (i) the
underlying collateral has weighted average FICO scores between 680 and 720 or (ii) for instances
where FICO scores are greater than 720, RMBS have 30% or less of the underlying collateral
composed of full documentation loans.
(4) Net of underwriting fees.
(5) Excludes positions in SIVs.
(6) Excludes write-downs from buy-backs of ARS.
(7) Recorded as net interest revenue.