Citibank 2010 Annual Report Download - page 64
Download and view the complete annual report
Please find page 64 of the 2010 Citibank annual report below. You can navigate through the pages in the report by either clicking on the pages listed below, or by using the keyword search tool below to find specific information within the annual report.-
 1
1 -
2
-
3
-
4
-
5
-
6
-
7
-
8
-
9
-
10
-
11
-
12
-
13
-
14
-
15
-
16
-
17
-
18
-
19
-
20
-
21
-
22
-
23
-
24
-
25
-
26
-
27
-
28
-
29
-
30
-
31
-
32
-
33
-
34
-
35
-
36
-
37
-
38
-
39
-
40
-
41
-
42
-
43
-
44
-
45
-
46
-
47
-
48
-
49
-
50
-
51
-
52
-
53
-
 54
54 -
 55
55 -
 56
56 -
 57
57 -
 58
58 -
 59
59 -
 60
60 -
 61
61 -
 62
62 -
 63
63 -
 64
64 -
 65
65 -
 66
66 -
 67
67 -
 68
68 -
 69
69 -
 70
70 -
 71
71 -
 72
72 -
 73
73 -
 74
74 -
75
-
76
-
77
-
78
-
79
-
80
-
81
-
82
-
83
-
84
-
85
-
86
-
87
-
88
-
89
-
90
-
91
-
92
-
93
-
94
-
95
-
96
-
97
-
98
-
99
-
100
-
101
-
102
-
103
-
104
-
105
-
106
-
107
-
108
-
109
-
110
-
111
-
112
-
113
-
114
-
115
-
116
-
117
-
118
-
119
-
120
-
121
-
122
-
123
-
124
-
125
-
126
-
127
-
128
-
129
-
130
-
131
-
132
-
133
-
134
-
135
-
136
-
137
-
138
-
139
-
140
-
141
-
142
-
143
-
144
-
145
-
146
-
147
-
148
-
149
-
150
-
151
-
152
-
153
-
154
-
155
-
156
-
157
-
158
-
159
-
160
-
161
-
162
-
163
-
164
-
165
-
166
-
167
-
168
-
169
-
170
-
171
-
172
-
173
-
174
-
175
-
176
-
177
-
178
-
179
-
180
-
181
-
182
-
183
-
184
-
185
-
186
-
187
-
188
-
189
-
190
-
191
-
192
-
193
-
194
-
195
-
196
-
197
-
198
-
199
-
200
-
201
-
202
-
203
-
204
-
205
-
206
-
207
-
208
-
209
-
210
-
211
-
212
-
213
-
214
-
215
-
216
-
217
-
218
-
219
-
220
-
221
-
222
-
223
-
224
-
225
-
226
-
227
-
228
-
229
-
230
-
231
-
232
-
233
-
234
-
235
-
236
-
237
-
238
-
239
-
240
-
241
-
242
-
243
-
244
-
245
-
246
-
247
-
248
-
249
-
250
-
251
-
252
-
253
-
254
-
255
-
256
-
257
-
258
-
259
-
260
-
261
-
262
-
263
-
264
-
265
-
266
-
267
-
268
-
269
-
270
-
271
-
272
-
273
-
274
-
275
-
276
-
277
-
278
-
279
-
280
-
281
-
282
-
283
-
284
-
285
-
286
-
287
-
288
-
289
-
290
-
291
-
292
-
293
-
294
-
295
-
296
-
297
-
298
-
299
-
300
-
301
-
302
-
303
-
304
-
305
-
306
-
307
-
308
-
309
-
310
-
311
-
312
 |
 |

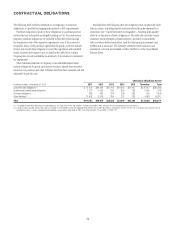
62
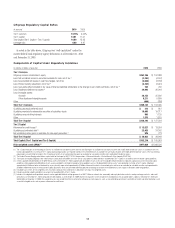
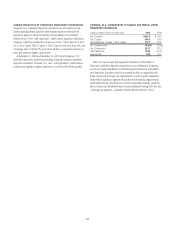
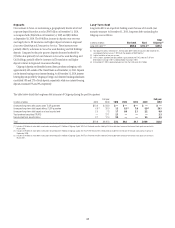
Impact of Changes on Capital Ratios
The following table presents the estimated sensitivity of Citigroup’s and
Citibank, N.A.’s capital ratios to changes of $100 million in Tier 1 Common,
Tier 1 Capital, or Total Capital (numerator), or changes of $1 billion in
risk-weighted assets or adjusted average total assets (denominator), based on
financial information as of December 31, 2010. This information is provided
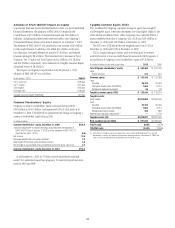
Broker-Dealer Subsidiaries
At December 31, 2010, Citigroup Global Markets Inc., a broker-dealer
registered with the SEC that is an indirect wholly owned subsidiary of
Citigroup Global Markets Holdings Inc., had net capital, computed in
accordance with the SEC’s net capital rule, of $8.9 billion, which exceeded
the minimum requirement by $8.2 billion.
In addition, certain of Citi’s broker-dealer subsidiaries are subject to
regulation in the other countries in which they do business, including
requirements to maintain specified levels of net capital or its equivalent.
Citigroup’s broker-dealer subsidiaries were in compliance with their capital
requirements at December 31, 2010.
for the purpose of analyzing the impact that a change in Citigroup’s or
Citibank, N.A.’s financial position or results of operations could have on these
ratios. These sensitivities only consider a single change to either a component
of capital, risk-weighted assets, or adjusted average total assets. Accordingly,
an event that affects more than one factor may have a larger basis point
impact than is reflected in this table.
Tier 1 Common ratio Tier 1 Capital ratio Total Capital ratio Leverage ratio
Impact of $100
million change in
Tier 1 Common
Impact of $1
billion change in
risk-weighted
assets
Impact of $100
million change
in Tier 1 Capital
Impact of $1
billion change in
risk-weighted
assets
Impact of $100
million change
in Total Capital
Impact of $1
billion change in
risk-weighted
assets
Impact of $100
million change
in Tier 1 Capital
Impact of $1
billion change
in adjusted
average total
assets
Citigroup 1.0 bps 1.1 bps 1.0 bps 1.3 bps 1.0 bps 1.7 bps 0.5 bps 0.3 bps
Citibank, N.A. 1.4 bps 2.2 bps 1.4 bps 2.2 bps 1.4 bps 2.5 bps 0.8 bps 0.7 bps