Citibank 2010 Annual Report Download - page 249
Download and view the complete annual report
Please find page 249 of the 2010 Citibank annual report below. You can navigate through the pages in the report by either clicking on the pages listed below, or by using the keyword search tool below to find specific information within the annual report.-
 1
1 -
2
-
3
-
4
-
5
-
6
-
7
-
8
-
9
-
10
-
11
-
12
-
13
-
14
-
15
-
16
-
17
-
18
-
19
-
20
-
21
-
22
-
23
-
24
-
25
-
26
-
27
-
28
-
29
-
30
-
31
-
32
-
33
-
34
-
35
-
36
-
37
-
38
-
39
-
40
-
41
-
42
-
43
-
44
-
45
-
46
-
47
-
48
-
49
-
50
-
51
-
52
-
53
-
54
-
55
-
56
-
57
-
58
-
59
-
60
-
61
-
62
-
63
-
64
-
65
-
66
-
67
-
68
-
69
-
70
-
71
-
72
-
73
-
74
-
75
-
76
-
77
-
78
-
79
-
80
-
81
-
82
-
83
-
84
-
85
-
86
-
87
-
88
-
89
-
90
-
91
-
92
-
93
-
94
-
95
-
96
-
97
-
98
-
99
-
100
-
101
-
102
-
103
-
104
-
105
-
106
-
107
-
108
-
109
-
110
-
111
-
112
-
113
-
114
-
115
-
116
-
117
-
118
-
119
-
120
-
121
-
122
-
123
-
124
-
125
-
126
-
127
-
128
-
129
-
130
-
131
-
132
-
133
-
134
-
135
-
136
-
137
-
138
-
139
-
140
-
141
-
142
-
143
-
144
-
145
-
146
-
147
-
148
-
149
-
150
-
151
-
152
-
153
-
154
-
155
-
156
-
157
-
158
-
159
-
160
-
161
-
162
-
163
-
164
-
165
-
166
-
167
-
168
-
169
-
170
-
171
-
172
-
173
-
174
-
175
-
176
-
177
-
178
-
179
-
180
-
181
-
182
-
183
-
184
-
185
-
186
-
187
-
188
-
189
-
190
-
191
-
192
-
193
-
194
-
195
-
196
-
197
-
198
-
199
-
200
-
201
-
202
-
203
-
204
-
205
-
206
-
207
-
208
-
209
-
210
-
211
-
212
-
213
-
214
-
215
-
216
-
217
-
218
-
219
-
220
-
221
-
222
-
223
-
224
-
225
-
226
-
227
-
228
-
229
-
230
-
231
-
232
-
233
-
234
-
235
-
236
-
237
-
238
-
 239
239 -
 240
240 -
 241
241 -
 242
242 -
 243
243 -
 244
244 -
 245
245 -
 246
246 -
 247
247 -
 248
248 -
 249
249 -
 250
250 -
 251
251 -
 252
252 -
 253
253 -
 254
254 -
 255
255 -
 256
256 -
 257
257 -
 258
258 -
 259
259 -
260
-
261
-
262
-
263
-
264
-
265
-
266
-
267
-
268
-
269
-
270
-
271
-
272
-
273
-
274
-
275
-
276
-
277
-
278
-
279
-
280
-
281
-
282
-
283
-
284
-
285
-
286
-
287
-
288
-
289
-
290
-
291
-
292
-
293
-
294
-
295
-
296
-
297
-
298
-
299
-
300
-
301
-
302
-
303
-
304
-
305
-
306
-
307
-
308
-
309
-
310
-
311
-
312
 |
 |

247
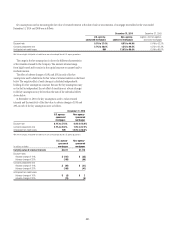
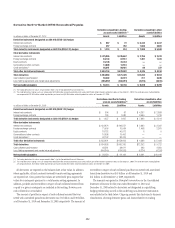
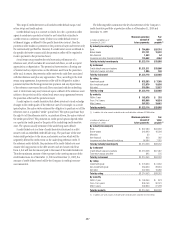
Key Assumptions and Retained Interests—Citi Holdings
The key assumptions, used for the securitization of CDOs and CLOs during
the year ended December 31, 2010, in measuring the fair value of retained
interests at the date of sale or securitization are as follows:
CDOs CLOs
Discount rate 14.7% to 40.6% 3.6% to 5.4%
The effect of two negative changes in discount rates used to determine the
fair value of retained interests is disclosed below.
In millions of dollars CDOs CLOs
Carrying value of retained interests $51 $618
Discount rates
Adverse change of 10% $ (3) $ (6)
Adverse change of 20% (6) (13)
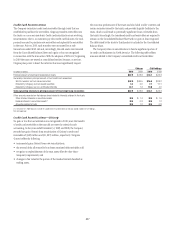
Asset-Based Financing
The Company provides loans and other forms of financing to VIEs that
hold assets. Those loans are subject to the same credit approvals as all
other loans originated or purchased by the Company. Financings in the
form of debt securities or derivatives are, in most circumstances, reported in
Trading account assets and accounted for at fair value through earnings.
The Company does not have the power to direct the activities that most
significantly impact these VIEs’ economic performance and thus it does not
consolidate them.
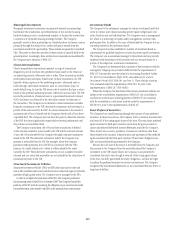
Asset-Based Financing—Citicorp
The primary types of Citicorp’s asset-based financings, total assets of the
unconsolidated VIEs with significant involvement and the Company’s
maximum exposure to loss at December 31, 2010 are shown below. For the
Company to realize that maximum loss, the VIE (borrower) would have to
default with no recovery from the assets held by the VIE.
In billions of dollars
Total
assets
Maximum
exposure
Type
Commercial and other real estate $ 0.9 $ 0.3
Hedge funds and equities 7.6 3.0
Airplanes, ships and other assets 7.6 7.9
Total $16.1 $11.2
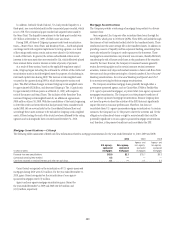
Asset-Based Financing—Citi Holdings
The primary types of Citi Holdings’ asset-based financings, total assets of
the unconsolidated VIEs with significant involvement and the Company’s
maximum exposure to loss at December 31, 2010 are shown below. For the
Company to realize that maximum loss, the VIE (borrower) would have to
default with no recovery from the assets held by the VIE.
In billions of dollars
Total
assets
Maximum
exposure
Type
Commercial and other real estate $12.2 $1.7
Corporate loans 6.0 5.0
Airplanes, ships and other assets 4.4 2.2
Total $22.6 $8.9
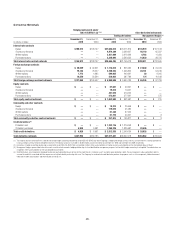
The following table summarizes selected cash flow information related to
asset-based financings for the years ended December 31, 2010, 2009 and 2008:
In billions of dollars 2010 2009 2008
Cash flows received on retained interests
and other net cash flows $2.8 $2.7 $1.7
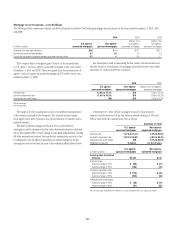
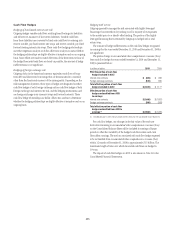
The effect of two negative changes in discount rates used to determine the
fair value of retained interests is disclosed below.
In millions of dollars
Asset-based
financing
Carrying value of retained interests $5,006
Value of underlying portfolio
Adverse change of 10% —
Adverse change of 20% (57)
Municipal Securities Tender Option Bond (TOB) Trusts
The Company sponsors TOB trusts that hold fixed- and floating-rate,
tax-exempt securities issued by state or local municipalities. The trusts are
typically single-issuer trusts whose assets are purchased from the Company
and from the market. The trusts are referred to as Tender Option Bond trusts
because the senior interest holders have the ability to tender their interests
periodically back to the issuing trust, as described further below.
The TOB trusts fund the purchase of their assets by issuing long-term
senior floating rate notes (floaters) and junior residual securities (residuals).
Floaters and residuals have a tenor equal to the maturity of the trust, which
is equal to or shorter than the tenor of the underlying municipal bond.
Residuals are frequently less than 1% of a trust’s total funding and entitle
their holder to residual cash flows from the issuing trust. Residuals are
generally rated based on the long-term rating of the underlying municipal
bond. Floaters bear interest rates that are typically reset weekly to a new
market rate (based on the SIFMA index: a seven-day high-grade market
index of tax-exempt, variable-rate municipal bonds). Floater holders have an
option to tender their floaters back to the trust periodically. Floaters have a
long-term rating based on the long-term rating of the underlying municipal
bond, including any credit enhancement provided by monoline insurance
companies, and a short-term rating based on that of the liquidity provider to
the trust.