Citibank 2010 Annual Report Download - page 211
Download and view the complete annual report
Please find page 211 of the 2010 Citibank annual report below. You can navigate through the pages in the report by either clicking on the pages listed below, or by using the keyword search tool below to find specific information within the annual report.-
 1
1 -
2
-
3
-
4
-
5
-
6
-
7
-
8
-
9
-
10
-
11
-
12
-
13
-
14
-
15
-
16
-
17
-
18
-
19
-
20
-
21
-
22
-
23
-
24
-
25
-
26
-
27
-
28
-
29
-
30
-
31
-
32
-
33
-
34
-
35
-
36
-
37
-
38
-
39
-
40
-
41
-
42
-
43
-
44
-
45
-
46
-
47
-
48
-
49
-
50
-
51
-
52
-
53
-
54
-
55
-
56
-
57
-
58
-
59
-
60
-
61
-
62
-
63
-
64
-
65
-
66
-
67
-
68
-
69
-
70
-
71
-
72
-
73
-
74
-
75
-
76
-
77
-
78
-
79
-
80
-
81
-
82
-
83
-
84
-
85
-
86
-
87
-
88
-
89
-
90
-
91
-
92
-
93
-
94
-
95
-
96
-
97
-
98
-
99
-
100
-
101
-
102
-
103
-
104
-
105
-
106
-
107
-
108
-
109
-
110
-
111
-
112
-
113
-
114
-
115
-
116
-
117
-
118
-
119
-
120
-
121
-
122
-
123
-
124
-
125
-
126
-
127
-
128
-
129
-
130
-
131
-
132
-
133
-
134
-
135
-
136
-
137
-
138
-
139
-
140
-
141
-
142
-
143
-
144
-
145
-
146
-
147
-
148
-
149
-
150
-
151
-
152
-
153
-
154
-
155
-
156
-
157
-
158
-
159
-
160
-
161
-
162
-
163
-
164
-
165
-
166
-
167
-
168
-
169
-
170
-
171
-
172
-
173
-
174
-
175
-
176
-
177
-
178
-
179
-
180
-
181
-
182
-
183
-
184
-
185
-
186
-
187
-
188
-
189
-
190
-
191
-
192
-
193
-
194
-
195
-
196
-
197
-
198
-
199
-
200
-
 201
201 -
 202
202 -
 203
203 -
 204
204 -
 205
205 -
 206
206 -
 207
207 -
 208
208 -
 209
209 -
 210
210 -
 211
211 -
 212
212 -
 213
213 -
 214
214 -
 215
215 -
 216
216 -
 217
217 -
 218
218 -
 219
219 -
 220
220 -
 221
221 -
222
-
223
-
224
-
225
-
226
-
227
-
228
-
229
-
230
-
231
-
232
-
233
-
234
-
235
-
236
-
237
-
238
-
239
-
240
-
241
-
242
-
243
-
244
-
245
-
246
-
247
-
248
-
249
-
250
-
251
-
252
-
253
-
254
-
255
-
256
-
257
-
258
-
259
-
260
-
261
-
262
-
263
-
264
-
265
-
266
-
267
-
268
-
269
-
270
-
271
-
272
-
273
-
274
-
275
-
276
-
277
-
278
-
279
-
280
-
281
-
282
-
283
-
284
-
285
-
286
-
287
-
288
-
289
-
290
-
291
-
292
-
293
-
294
-
295
-
296
-
297
-
298
-
299
-
300
-
301
-
302
-
303
-
304
-
305
-
306
-
307
-
308
-
309
-
310
-
311
-
312
 |
 |
209
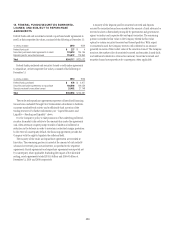
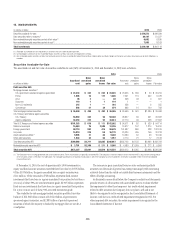
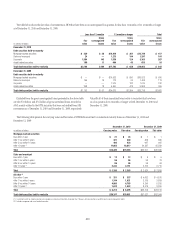
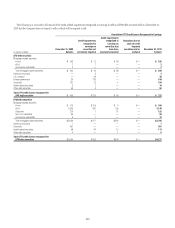
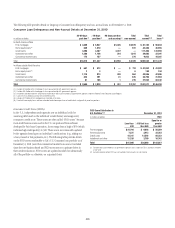
Debt Securities Held-to-Maturity
The carrying value and fair value of securities held-to-maturity (HTM) at December 31, 2010 and December 31, 2009 were as follows:
In millions of dollars
Amortized
cost (1)
Net unrealized
loss
recognized
in AOCI
Carrying
value (2)
Gross
unrecognized
gains
Gross
unrecognized
losses
Fair
value
December 31, 2010
Debt securities held-to-maturity
Mortgage-backed securities (3)
Prime $ 4,748 $ 794 $ 3,954 $ 379 $ 11 $ 4,322
Alt-A 11,816 3,008 8,808 536 166 9,178
Subprime 708 75 633 9 72 570
Non-U.S. residential 5,010 793 4,217 259 72 4,404
Commercial 908 21 887 18 96 809
Total mortgage-backed securities $23,190 $4,691 $18,499 $ 1,201 $ 417 $ 19,283
State and municipal 2,523 127 2,396 11 104 2,303
Corporate 6,569 145 6,424 447 267 6,604
Asset-backed securities (3) 1,855 67 1,788 57 54 1,791
Total debt securities held-to-maturity $34,137 $5,030 $29,107 $1,716 $ 842 $ 29,981
December 31, 2009
Debt securities held-to-maturity
Mortgage-backed securities (3)
Prime $ 6,118 $ 1,151 $ 4,967 $ 317 $ 5 $ 5,279
Alt-A 14,710 4,276 10,434 905 243 11,096
Subprime 1,087 128 959 77 100 936
Non-U.S. residential 9,002 1,119 7,883 469 134 8,218
Commercial 1,303 45 1,258 1 208 1,051
Total mortgage-backed securities $32,220 $ 6,719 $25,501 $ 1,769 $ 690 $ 26,580
State and municipal 3,067 147 2,920 92 113 2,899
Corporate 7,457 264 7,193 524 182 7,535
Asset-backed securities (3) 16,348 435 15,913 567 496 15,984
Total debt securities held-to-maturity $59,092 $ 7,565 $51,527 $ 2,952 $ 1,481 $ 52,998
(1) For securities transferred to HTM from Trading account assets, amortized cost is defined as the fair value amount of the securities at the date of transfer plus any accretion income and less any impairments recognized
in earnings subsequent to transfer. For securities transferred to HTM from AFS, amortized cost is defined as the original purchase cost, plus or minus any accretion or amortization of a purchase discount or premium,
less any impairment recognized in earnings.
(2) HTM securities are carried on the Consolidated Balance Sheet at amortized cost and the changes in the value of these securities other than impairment charges are not reported on the financial statements, except for
HTM securities that have suffered credit impairment, for which declines in fair value for reasons other than credit losses are recorded in AOCI.
(3) The Company invests in mortgage-backed and asset-backed securities. These securitizations are generally considered variable interest entities (VIEs). The Company's maximum exposure to loss from these VIEs is equal
to the carrying amount of the securities, which is reflected in the table above. For mortgage-backed and asset-backed securitizations in which the Company has other involvement, information is provided in Note 22 to
the Consolidated Financial Statements.
The net unrealized losses classified in AOCI relate to debt securities
reclassified from AFS investments to HTM investments. Additionally, for
HTM securities that have suffered credit impairment, declines in fair value
for reasons other than credit losses are recorded in AOCI. The AOCI balance
was $5.0 billion as of December 31, 2010, compared to $7.6 billion as of
December 31, 2009. The AOCI balance for HTM securities is amortized over
the remaining life of the related securities as an adjustment of yield in a
manner consistent with the accretion of discount on the same debt securities.
This will have no impact on the Company’s net income because the
amortization of the unrealized holding loss reported in equity will offset the
effect on interest income of the accretion of the discount on these securities.
The credit-related impairment on HTM securities is recognized in earnings.