Citibank 2010 Annual Report Download - page 210
Download and view the complete annual report
Please find page 210 of the 2010 Citibank annual report below. You can navigate through the pages in the report by either clicking on the pages listed below, or by using the keyword search tool below to find specific information within the annual report.-
 1
1 -
2
-
3
-
4
-
5
-
6
-
7
-
8
-
9
-
10
-
11
-
12
-
13
-
14
-
15
-
16
-
17
-
18
-
19
-
20
-
21
-
22
-
23
-
24
-
25
-
26
-
27
-
28
-
29
-
30
-
31
-
32
-
33
-
34
-
35
-
36
-
37
-
38
-
39
-
40
-
41
-
42
-
43
-
44
-
45
-
46
-
47
-
48
-
49
-
50
-
51
-
52
-
53
-
54
-
55
-
56
-
57
-
58
-
59
-
60
-
61
-
62
-
63
-
64
-
65
-
66
-
67
-
68
-
69
-
70
-
71
-
72
-
73
-
74
-
75
-
76
-
77
-
78
-
79
-
80
-
81
-
82
-
83
-
84
-
85
-
86
-
87
-
88
-
89
-
90
-
91
-
92
-
93
-
94
-
95
-
96
-
97
-
98
-
99
-
100
-
101
-
102
-
103
-
104
-
105
-
106
-
107
-
108
-
109
-
110
-
111
-
112
-
113
-
114
-
115
-
116
-
117
-
118
-
119
-
120
-
121
-
122
-
123
-
124
-
125
-
126
-
127
-
128
-
129
-
130
-
131
-
132
-
133
-
134
-
135
-
136
-
137
-
138
-
139
-
140
-
141
-
142
-
143
-
144
-
145
-
146
-
147
-
148
-
149
-
150
-
151
-
152
-
153
-
154
-
155
-
156
-
157
-
158
-
159
-
160
-
161
-
162
-
163
-
164
-
165
-
166
-
167
-
168
-
169
-
170
-
171
-
172
-
173
-
174
-
175
-
176
-
177
-
178
-
179
-
180
-
181
-
182
-
183
-
184
-
185
-
186
-
187
-
188
-
189
-
190
-
191
-
192
-
193
-
194
-
195
-
196
-
197
-
198
-
199
-
 200
200 -
 201
201 -
 202
202 -
 203
203 -
 204
204 -
 205
205 -
 206
206 -
 207
207 -
 208
208 -
 209
209 -
 210
210 -
 211
211 -
 212
212 -
 213
213 -
 214
214 -
 215
215 -
 216
216 -
 217
217 -
 218
218 -
 219
219 -
 220
220 -
221
-
222
-
223
-
224
-
225
-
226
-
227
-
228
-
229
-
230
-
231
-
232
-
233
-
234
-
235
-
236
-
237
-
238
-
239
-
240
-
241
-
242
-
243
-
244
-
245
-
246
-
247
-
248
-
249
-
250
-
251
-
252
-
253
-
254
-
255
-
256
-
257
-
258
-
259
-
260
-
261
-
262
-
263
-
264
-
265
-
266
-
267
-
268
-
269
-
270
-
271
-
272
-
273
-
274
-
275
-
276
-
277
-
278
-
279
-
280
-
281
-
282
-
283
-
284
-
285
-
286
-
287
-
288
-
289
-
290
-
291
-
292
-
293
-
294
-
295
-
296
-
297
-
298
-
299
-
300
-
301
-
302
-
303
-
304
-
305
-
306
-
307
-
308
-
309
-
310
-
311
-
312
 |
 |

208
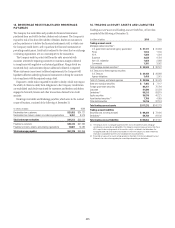
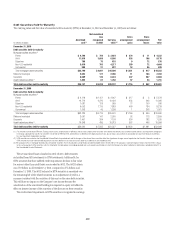
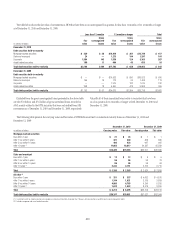
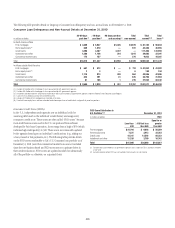
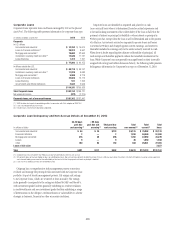
The following table presents the amortized cost and fair value of debt securities available-for-sale by contractual maturity dates as of December 31, 2010 and
December 31, 2009:
December 31, 2010 December 31, 2009
In millions of dollars
Amortized
Cost Fair value
Amortized
cost Fair value
Mortgage-backed securities (1)
Due within 1 year $ — $ — $ 2 $ 3
After 1 but within 5 years 403 375 16 16
After 5 but within 10 years 402 419 626 597
After 10 years (2) 25,685 25,712 28,952 28,452
Total $ 26,490 $ 26,506 $ 29,596 $ 29,068
U.S. Treasury and federal agencies
Due within 1 year $ 36,411 $ 36,443 $ 5,357 $ 5,366
After 1 but within 5 years 52,558 53,118 35,912 35,618
After 5 but within 10 years 10,604 10,647 8,815 8,773
After 10 years (2) 1,790 1,854 4,487 4,357
Total $101,363 $102,062 $ 54,571 $ 54,114
State and municipal
Due within 1 year $ 9 $ 9 $ 7 $ 8
After 1 but within 5 years 145 149 119 129
After 5 but within 10 years 230 235 340 359
After 10 years (2) 15,276 12,842 16,211 15,114
Total $ 15,660 $ 13,235 $ 16,677 $ 15,610
Foreign government
Due within 1 year $ 41,856 $ 41,387 $ 32,223 $ 32,365
After 1 but within 5 years 49,983 50,739 61,165 61,426
After 5 but within 10 years 6,143 6,264 7,844 7,845
After 10 years (2) 1,128 1,289 755 883
Total $ 99,110 $ 99,679 $101,987 $102,519
All other (3)
Due within 1 year $ 2,162 $ 2,164 $ 4,243 $ 4,244
After 1 but within 5 years 17,838 17,947 14,286 14,494
After 5 but within 10 years 2,610 2,714 9,483 9,597
After 10 years (2) 4,333 4,305 4,280 4,147
Total $ 26,943 $ 27,130 $ 32,292 $ 32,482
Total debt securities AFS $269,566 $268,612 $235,123 $233,793
(1) Includes mortgage-backed securities of U.S. federal agencies.
(2) Investments with no stated maturities are included as contractual maturities of greater than 10 years. Actual maturities may differ due to call or prepayment rights.
(3) Includes corporate, asset-backed and other debt securities.
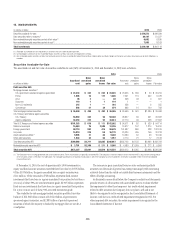
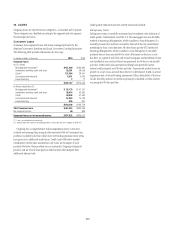
The following table presents interest and dividends on investments:
In millions of dollars 2010 2009 2008
Taxable interest $10,160 $11,970 $ 9,407
Interest exempt from U.S. federal income tax 758 864 836
Dividends 321 285 475
Total interest and dividends $11,239 $13,119 $10,718
The following table presents realized gains and losses on all investments.
The gross realized investment losses exclude losses from other-than-
temporary impairment:
In millions of dollars 2010 2009 2008
Gross realized investment gains $2,873 $ 2,090 $ 837
Gross realized investment losses (462) (94) (158)
Net realized gains (losses) $2,411 $ 1,996 $ 679
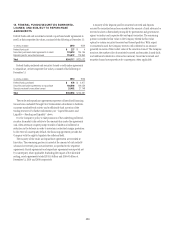
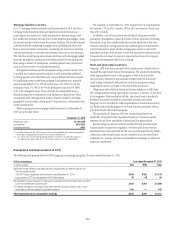
During the first quarter of 2010, the Company sold several corporate
debt securities that were classified as held-to-maturity. These sales were in
response to a significant deterioration in the creditworthiness of the issuers.
The securities sold had a carrying value of $413 million and the Company
recorded a realized loss of $49 million.