Citibank 2010 Annual Report Download - page 202
Download and view the complete annual report
Please find page 202 of the 2010 Citibank annual report below. You can navigate through the pages in the report by either clicking on the pages listed below, or by using the keyword search tool below to find specific information within the annual report.-
 1
1 -
2
-
3
-
4
-
5
-
6
-
7
-
8
-
9
-
10
-
11
-
12
-
13
-
14
-
15
-
16
-
17
-
18
-
19
-
20
-
21
-
22
-
23
-
24
-
25
-
26
-
27
-
28
-
29
-
30
-
31
-
32
-
33
-
34
-
35
-
36
-
37
-
38
-
39
-
40
-
41
-
42
-
43
-
44
-
45
-
46
-
47
-
48
-
49
-
50
-
51
-
52
-
53
-
54
-
55
-
56
-
57
-
58
-
59
-
60
-
61
-
62
-
63
-
64
-
65
-
66
-
67
-
68
-
69
-
70
-
71
-
72
-
73
-
74
-
75
-
76
-
77
-
78
-
79
-
80
-
81
-
82
-
83
-
84
-
85
-
86
-
87
-
88
-
89
-
90
-
91
-
92
-
93
-
94
-
95
-
96
-
97
-
98
-
99
-
100
-
101
-
102
-
103
-
104
-
105
-
106
-
107
-
108
-
109
-
110
-
111
-
112
-
113
-
114
-
115
-
116
-
117
-
118
-
119
-
120
-
121
-
122
-
123
-
124
-
125
-
126
-
127
-
128
-
129
-
130
-
131
-
132
-
133
-
134
-
135
-
136
-
137
-
138
-
139
-
140
-
141
-
142
-
143
-
144
-
145
-
146
-
147
-
148
-
149
-
150
-
151
-
152
-
153
-
154
-
155
-
156
-
157
-
158
-
159
-
160
-
161
-
162
-
163
-
164
-
165
-
166
-
167
-
168
-
169
-
170
-
171
-
172
-
173
-
174
-
175
-
176
-
177
-
178
-
179
-
180
-
181
-
182
-
183
-
184
-
185
-
186
-
187
-
188
-
189
-
190
-
191
-
 192
192 -
 193
193 -
 194
194 -
 195
195 -
 196
196 -
 197
197 -
 198
198 -
 199
199 -
 200
200 -
 201
201 -
 202
202 -
 203
203 -
 204
204 -
 205
205 -
 206
206 -
 207
207 -
 208
208 -
 209
209 -
 210
210 -
 211
211 -
 212
212 -
213
-
214
-
215
-
216
-
217
-
218
-
219
-
220
-
221
-
222
-
223
-
224
-
225
-
226
-
227
-
228
-
229
-
230
-
231
-
232
-
233
-
234
-
235
-
236
-
237
-
238
-
239
-
240
-
241
-
242
-
243
-
244
-
245
-
246
-
247
-
248
-
249
-
250
-
251
-
252
-
253
-
254
-
255
-
256
-
257
-
258
-
259
-
260
-
261
-
262
-
263
-
264
-
265
-
266
-
267
-
268
-
269
-
270
-
271
-
272
-
273
-
274
-
275
-
276
-
277
-
278
-
279
-
280
-
281
-
282
-
283
-
284
-
285
-
286
-
287
-
288
-
289
-
290
-
291
-
292
-
293
-
294
-
295
-
296
-
297
-
298
-
299
-
300
-
301
-
302
-
303
-
304
-
305
-
306
-
307
-
308
-
309
-
310
-
311
-
312
 |
 |

200
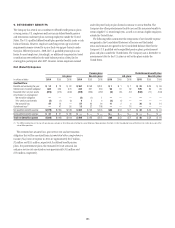
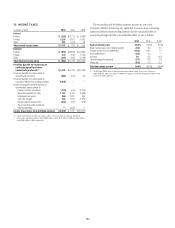
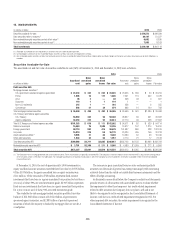
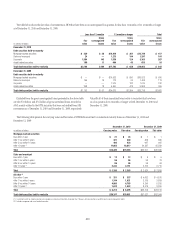
Deferred income taxes at December 31 related to the following:
In millions of dollars 2010 2009 (1)
Deferred tax assets
Credit loss deduction $16,781 $13,606
Deferred compensation and employee benefits 3,980 4,204
Restructuring and settlement reserves 1,212 833
Unremitted foreign earnings 5,673 7,078
Investment and loan basis differences 1,572 56
Cash flow hedges 1,581 1,906
Tax credit and net operating loss carryforwards 23,204 20,787
Other deferred tax assets 2,441 2,630
Gross deferred tax assets $56,444 $51,100
Valuation allowance $ — $ —
Deferred tax assets after valuation allowance $56,444 $51,100
Deferred tax liabilities
Deferred policy acquisition costs
and value of insurance in force $ (737) (791)
Fixed assets and leases (1,340) (1,339)
Interest-related items (116) (353)
Intangibles (1,814) (1,963)
Credit valuation adjustment on Company-issued debt (61) (277)
Other deferred tax liabilities (281) (325)
Gross deferred tax liabilities $ (4,349) $ (5,048)
Net deferred tax asset $52,095 $46,052
(1) Reclassified to conform to the current period’s presentation.
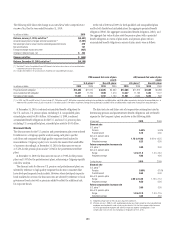
The following is a roll-forward of the Company’s unrecognized tax benefits.
In millions of dollars 2010 2009 2008
Total unrecognized tax benefits at January 1 $3,079 $3,468 $ 3,698
Net amount of increases for current year’s tax positions 1,039 195 254
Gross amount of increases for prior years’ tax positions 371 392 252
Gross amount of decreases for prior years’ tax positions (421) (870) (581)
Amounts of decreases relating to settlements (14) (104) (21)
Reductions due to lapse of statutes of limitation (11) (12) (30)
Foreign exchange, acquisitions and dispositions (8) 10 (104)
Total unrecognized tax benefits at December 31 $4,035 $3,079 $ 3,468
Total amount of unrecognized tax benefits at December 31, 2010,
2009 and 2008 that, if recognized, would affect the effective tax rate are
$2.1 billion, $2.2 billion and $2.4 billion, respectively. The remainder of the
uncertain tax positions have offsetting amounts in other jurisdictions or are
temporary differences, except for $0.8 billion at December 31, 2010, which
would be booked directly to Retained earnings.
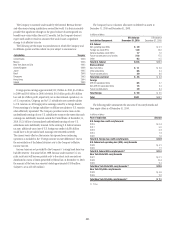
Interest and penalties (not included in the “unrecognized tax benefits” above) are a component of the Provision for income taxes.
2010 2009 2008
In millions of dollars Pretax Net of tax Pretax Net of tax Pretax Net of tax
Total interest and penalties in the balance sheet at January 1 $370 $239 $ 663 $ 420 $618 $389
Total interest and penalties in the statement of income (16) (12) (250) (154) 114 81
Total interest and penalties in the balance sheet at December 31 (1) 348 223 370 239 663 420
(1) Includes $9 million for foreign penalties and $4 million for state penalties.