Citibank 2010 Annual Report Download - page 272
Download and view the complete annual report
Please find page 272 of the 2010 Citibank annual report below. You can navigate through the pages in the report by either clicking on the pages listed below, or by using the keyword search tool below to find specific information within the annual report.-
 1
1 -
2
-
3
-
4
-
5
-
6
-
7
-
8
-
9
-
10
-
11
-
12
-
13
-
14
-
15
-
16
-
17
-
18
-
19
-
20
-
21
-
22
-
23
-
24
-
25
-
26
-
27
-
28
-
29
-
30
-
31
-
32
-
33
-
34
-
35
-
36
-
37
-
38
-
39
-
40
-
41
-
42
-
43
-
44
-
45
-
46
-
47
-
48
-
49
-
50
-
51
-
52
-
53
-
54
-
55
-
56
-
57
-
58
-
59
-
60
-
61
-
62
-
63
-
64
-
65
-
66
-
67
-
68
-
69
-
70
-
71
-
72
-
73
-
74
-
75
-
76
-
77
-
78
-
79
-
80
-
81
-
82
-
83
-
84
-
85
-
86
-
87
-
88
-
89
-
90
-
91
-
92
-
93
-
94
-
95
-
96
-
97
-
98
-
99
-
100
-
101
-
102
-
103
-
104
-
105
-
106
-
107
-
108
-
109
-
110
-
111
-
112
-
113
-
114
-
115
-
116
-
117
-
118
-
119
-
120
-
121
-
122
-
123
-
124
-
125
-
126
-
127
-
128
-
129
-
130
-
131
-
132
-
133
-
134
-
135
-
136
-
137
-
138
-
139
-
140
-
141
-
142
-
143
-
144
-
145
-
146
-
147
-
148
-
149
-
150
-
151
-
152
-
153
-
154
-
155
-
156
-
157
-
158
-
159
-
160
-
161
-
162
-
163
-
164
-
165
-
166
-
167
-
168
-
169
-
170
-
171
-
172
-
173
-
174
-
175
-
176
-
177
-
178
-
179
-
180
-
181
-
182
-
183
-
184
-
185
-
186
-
187
-
188
-
189
-
190
-
191
-
192
-
193
-
194
-
195
-
196
-
197
-
198
-
199
-
200
-
201
-
202
-
203
-
204
-
205
-
206
-
207
-
208
-
209
-
210
-
211
-
212
-
213
-
214
-
215
-
216
-
217
-
218
-
219
-
220
-
221
-
222
-
223
-
224
-
225
-
226
-
227
-
228
-
229
-
230
-
231
-
232
-
233
-
234
-
235
-
236
-
237
-
238
-
239
-
240
-
241
-
242
-
243
-
244
-
245
-
246
-
247
-
248
-
249
-
250
-
251
-
252
-
253
-
254
-
255
-
256
-
257
-
258
-
259
-
260
-
261
-
 262
262 -
 263
263 -
 264
264 -
 265
265 -
 266
266 -
 267
267 -
 268
268 -
 269
269 -
 270
270 -
 271
271 -
 272
272 -
 273
273 -
 274
274 -
 275
275 -
 276
276 -
 277
277 -
 278
278 -
 279
279 -
 280
280 -
 281
281 -
 282
282 -
283
-
284
-
285
-
286
-
287
-
288
-
289
-
290
-
291
-
292
-
293
-
294
-
295
-
296
-
297
-
298
-
299
-
300
-
301
-
302
-
303
-
304
-
305
-
306
-
307
-
308
-
309
-
310
-
311
-
312
 |
 |

270
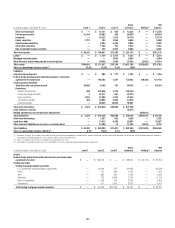
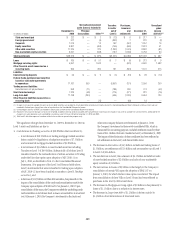
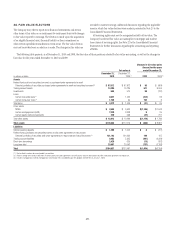
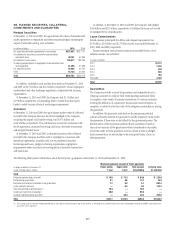
The significant changes from December 31, 2008 to December 31, 2009 in
Level 3 assets and liabilities are due to:
A net decrease in trading securities of $10.8 billion that was driven by:•
Net transfers of $6.5 billion, due mainly to the transfer of debt –
securities from Level 3 to Level 2 due to increased liquidity and
pricing transparency; and
Net settlements of $5.8 billion, due primarily to the liquidations of –
subprime securities of $4.1 billion.
The change in net trading derivatives driven by:•
A net loss of $4.9 billion relating to complex derivative contracts, –
such as those linked to credit, equity and commodity exposures.
These losses include both realized and unrealized losses during 2009
and are partially offset by gains recognized in instruments that have
been classified in Levels 1 and 2; and
Net increase in derivative assets of $4.3 billion, which includes cash –
settlements of derivative contracts in an unrealized loss position,
notably those linked to subprime exposures.
The decrease in Level 3 Investments of $6.9 billion primarily •
resulted from:
A reduction of $5.0 billion, due mainly to paydowns on debt –
securities and sales of private equity investments;
The net transfer of investment securities from Level 3 to Level 2 –
of $1.5 billion, due to increased availability of observable pricing
inputs; and
Net losses recognized of $0.4 billion due mainly to losses on non- –
marketable equity securities including write-downs on private equity
investments.
The decrease in securities sold under agreements to repurchase of •
$9.1 billion is driven by a $8.6 billion net transfers from Level 3 to Level 2
as effective maturity dates on structured repos have shortened.
The decrease in long-term debt of $1.5 billion is driven mainly by •
$1.3 billion of net terminations of structured notes.
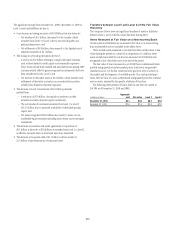
Transfers between Level 1 and Level 2 of the Fair Value
Hierarchy
The Company did not have any significant transfers of assets or liabilities
between Levels 1 and 2 of the fair value hierarchy during 2010.
Items Measured at Fair Value on a Nonrecurring Basis
Certain assets and liabilities are measured at fair value on a nonrecurring
basis and therefore are not included in the tables above.
These include assets measured at cost that have been written down to fair
value during the periods as a result of an impairment. In addition, these
assets include loans held-for-sale that are measured at LOCOM that were
recognized at fair value below cost at the end of the period.
The fair value of loans measured on a LOCOM basis is determined where
possible using quoted secondary-market prices. Such loans are generally
classified as Level 2 of the fair value hierarchy given the level of activity in
the market and the frequency of available quotes. If no such quoted price
exists, the fair value of a loan is determined using quoted prices for a similar
asset or assets, adjusted for the specific attributes of that loan.
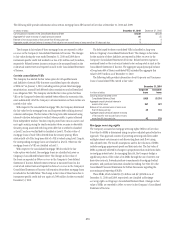
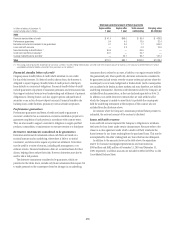
The following table presents all loans held-for-sale that are carried at
LOCOM as of December 31, 2010 and 2009:
In billions of dollars
Aggregate
cost Fair value Level 2 Level 3
December 31, 2010 $3.1 $2.5 $0.7 $1.8
December 31, 2009 $2.5 $1.6 $0.3 $1.3