Citibank 2010 Annual Report Download - page 198
Download and view the complete annual report
Please find page 198 of the 2010 Citibank annual report below. You can navigate through the pages in the report by either clicking on the pages listed below, or by using the keyword search tool below to find specific information within the annual report.-
 1
1 -
2
-
3
-
4
-
5
-
6
-
7
-
8
-
9
-
10
-
11
-
12
-
13
-
14
-
15
-
16
-
17
-
18
-
19
-
20
-
21
-
22
-
23
-
24
-
25
-
26
-
27
-
28
-
29
-
30
-
31
-
32
-
33
-
34
-
35
-
36
-
37
-
38
-
39
-
40
-
41
-
42
-
43
-
44
-
45
-
46
-
47
-
48
-
49
-
50
-
51
-
52
-
53
-
54
-
55
-
56
-
57
-
58
-
59
-
60
-
61
-
62
-
63
-
64
-
65
-
66
-
67
-
68
-
69
-
70
-
71
-
72
-
73
-
74
-
75
-
76
-
77
-
78
-
79
-
80
-
81
-
82
-
83
-
84
-
85
-
86
-
87
-
88
-
89
-
90
-
91
-
92
-
93
-
94
-
95
-
96
-
97
-
98
-
99
-
100
-
101
-
102
-
103
-
104
-
105
-
106
-
107
-
108
-
109
-
110
-
111
-
112
-
113
-
114
-
115
-
116
-
117
-
118
-
119
-
120
-
121
-
122
-
123
-
124
-
125
-
126
-
127
-
128
-
129
-
130
-
131
-
132
-
133
-
134
-
135
-
136
-
137
-
138
-
139
-
140
-
141
-
142
-
143
-
144
-
145
-
146
-
147
-
148
-
149
-
150
-
151
-
152
-
153
-
154
-
155
-
156
-
157
-
158
-
159
-
160
-
161
-
162
-
163
-
164
-
165
-
166
-
167
-
168
-
169
-
170
-
171
-
172
-
173
-
174
-
175
-
176
-
177
-
178
-
179
-
180
-
181
-
182
-
183
-
184
-
185
-
186
-
187
-
 188
188 -
 189
189 -
 190
190 -
 191
191 -
 192
192 -
 193
193 -
 194
194 -
 195
195 -
 196
196 -
 197
197 -
 198
198 -
 199
199 -
 200
200 -
 201
201 -
 202
202 -
 203
203 -
 204
204 -
 205
205 -
 206
206 -
 207
207 -
 208
208 -
209
-
210
-
211
-
212
-
213
-
214
-
215
-
216
-
217
-
218
-
219
-
220
-
221
-
222
-
223
-
224
-
225
-
226
-
227
-
228
-
229
-
230
-
231
-
232
-
233
-
234
-
235
-
236
-
237
-
238
-
239
-
240
-
241
-
242
-
243
-
244
-
245
-
246
-
247
-
248
-
249
-
250
-
251
-
252
-
253
-
254
-
255
-
256
-
257
-
258
-
259
-
260
-
261
-
262
-
263
-
264
-
265
-
266
-
267
-
268
-
269
-
270
-
271
-
272
-
273
-
274
-
275
-
276
-
277
-
278
-
279
-
280
-
281
-
282
-
283
-
284
-
285
-
286
-
287
-
288
-
289
-
290
-
291
-
292
-
293
-
294
-
295
-
296
-
297
-
298
-
299
-
300
-
301
-
302
-
303
-
304
-
305
-
306
-
307
-
308
-
309
-
310
-
311
-
312
 |
 |

196
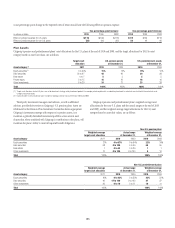
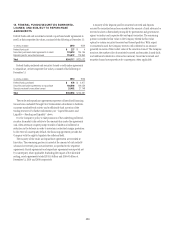
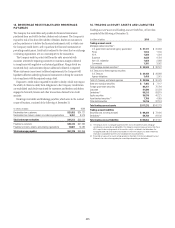
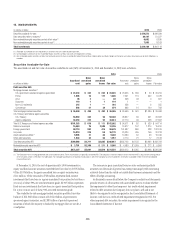
Fair Value Disclosure
Plan assets by detailed asset categories and the fair value hierarchy are as follows:
In millions of dollars U.S. pension and postretirement benefit plans (1)
Fair value measurement at December 31, 2010
Asset categories Level 1 Level 2 Level 3 Total
Equity securities
U.S. equity $ 961 $ 9 $ — $ 970
Non-U.S. equity 432 4 — 436
Mutual funds 1,262 — — 1,262
Debt securities
U.S. treasuries 1,039 — — 1,039
U.S. agency — 90 — 90
U.S. corporate bonds — 1,050 5 1,055
Non-U.S. government debt — 243 — 243
Non-U.S. corporate bonds — 219 1 220
State and municipal debt — 62 — 62
Hedge funds — 1,542 1,014 2,556
Asset-backed securities — 28 — 28
Mortgage-backed securities — 25 — 25
Annuity contracts — — 187 187
Private equity — — 2,920 2,920
Other investments (2) 2 44 4 50
Total investments at fair value $3,696 $3,316 $4,131 $11,143
Cash and cash equivalents $ 152 $ 361 $ — $ 513
Total assets $3,848 $3,677 $4,131 $11,656
(1) The investments of the U.S. pension and postretirement benefit plans are commingled in one trust. At December 31, 2010, the allocable interests of the U.S. pension and postretirement benefit plans were 99.2% and
0.8%, respectively.
(2) Other investments classified as Level 1 include futures carried at fair value.
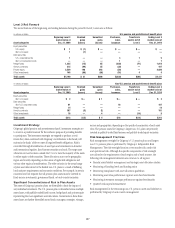
In millions of dollars Non-U.S. pension and postretirement benefit plan
Fair value measurement at December 31, 2010
Asset categories Level 1 Level 2 Level 3 Total
Equity securities
U.S. equity $ 12 $ 20 $ — $ 32
Non-U.S. equity 117 423 3 543
Mutual funds 183 4,773 — 4,956
Debt securities
U.S. treasuries 2 26 — 28
U.S. corporate bonds — 354 — 354
Non-U.S. government debt 167 404 — 571
Non-U.S. corporate bonds 4 354 107 465
State and municipal debt — 15 — 15
Hedge funds 4 — 14 18
Mortgage-backed securities — 2 — 2
Annuity contracts — — 181 181
Other investments 9 29 8 45
Total investments at fair value $498 $6,400 $313 $7,210
Cash and cash equivalents $ 92 $ 18 $ — $ 111
Total assets $590 $6,418 $313 $7,321