Citibank 2010 Annual Report Download - page 238
Download and view the complete annual report
Please find page 238 of the 2010 Citibank annual report below. You can navigate through the pages in the report by either clicking on the pages listed below, or by using the keyword search tool below to find specific information within the annual report.-
 1
1 -
2
-
3
-
4
-
5
-
6
-
7
-
8
-
9
-
10
-
11
-
12
-
13
-
14
-
15
-
16
-
17
-
18
-
19
-
20
-
21
-
22
-
23
-
24
-
25
-
26
-
27
-
28
-
29
-
30
-
31
-
32
-
33
-
34
-
35
-
36
-
37
-
38
-
39
-
40
-
41
-
42
-
43
-
44
-
45
-
46
-
47
-
48
-
49
-
50
-
51
-
52
-
53
-
54
-
55
-
56
-
57
-
58
-
59
-
60
-
61
-
62
-
63
-
64
-
65
-
66
-
67
-
68
-
69
-
70
-
71
-
72
-
73
-
74
-
75
-
76
-
77
-
78
-
79
-
80
-
81
-
82
-
83
-
84
-
85
-
86
-
87
-
88
-
89
-
90
-
91
-
92
-
93
-
94
-
95
-
96
-
97
-
98
-
99
-
100
-
101
-
102
-
103
-
104
-
105
-
106
-
107
-
108
-
109
-
110
-
111
-
112
-
113
-
114
-
115
-
116
-
117
-
118
-
119
-
120
-
121
-
122
-
123
-
124
-
125
-
126
-
127
-
128
-
129
-
130
-
131
-
132
-
133
-
134
-
135
-
136
-
137
-
138
-
139
-
140
-
141
-
142
-
143
-
144
-
145
-
146
-
147
-
148
-
149
-
150
-
151
-
152
-
153
-
154
-
155
-
156
-
157
-
158
-
159
-
160
-
161
-
162
-
163
-
164
-
165
-
166
-
167
-
168
-
169
-
170
-
171
-
172
-
173
-
174
-
175
-
176
-
177
-
178
-
179
-
180
-
181
-
182
-
183
-
184
-
185
-
186
-
187
-
188
-
189
-
190
-
191
-
192
-
193
-
194
-
195
-
196
-
197
-
198
-
199
-
200
-
201
-
202
-
203
-
204
-
205
-
206
-
207
-
208
-
209
-
210
-
211
-
212
-
213
-
214
-
215
-
216
-
217
-
218
-
219
-
220
-
221
-
222
-
223
-
224
-
225
-
226
-
227
-
 228
228 -
 229
229 -
 230
230 -
 231
231 -
 232
232 -
 233
233 -
 234
234 -
 235
235 -
 236
236 -
 237
237 -
 238
238 -
 239
239 -
 240
240 -
 241
241 -
 242
242 -
 243
243 -
 244
244 -
 245
245 -
 246
246 -
 247
247 -
 248
248 -
249
-
250
-
251
-
252
-
253
-
254
-
255
-
256
-
257
-
258
-
259
-
260
-
261
-
262
-
263
-
264
-
265
-
266
-
267
-
268
-
269
-
270
-
271
-
272
-
273
-
274
-
275
-
276
-
277
-
278
-
279
-
280
-
281
-
282
-
283
-
284
-
285
-
286
-
287
-
288
-
289
-
290
-
291
-
292
-
293
-
294
-
295
-
296
-
297
-
298
-
299
-
300
-
301
-
302
-
303
-
304
-
305
-
306
-
307
-
308
-
309
-
310
-
311
-
312
 |
 |

236
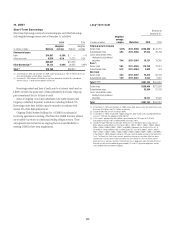
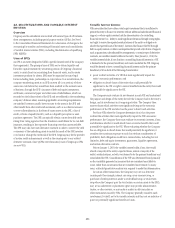
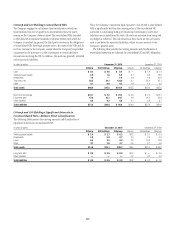
Citicorp and Citi Holdings Consolidated VIEs
The Company engages in on-balance-sheet securitizations which are
securitizations that do not qualify for sales treatment; thus, the assets
remain on the Company’s balance sheet. The consolidated VIEs included
in the tables below represent hundreds of separate entities with which the
Company is involved. In general, the third-party investors in the obligations
of consolidated VIEs have legal recourse only to the assets of the VIEs and do
not have recourse to the Company, except where the Company has provided
a guarantee to the investors or is the counterparty to certain derivative
transactions involving the VIE. In addition, the assets are generally restricted
only to pay such liabilities.
Thus, the Company’s maximum legal exposure to loss related to consolidated
VIEs is significantly less than the carrying value of the consolidated VIE
assets due to outstanding third-party financing. Intercompany assets and
liabilities are excluded from the table. All assets are restricted from being sold
or pledged as collateral. The cash flows from these assets are the only source
used to pay down the associated liabilities, which are non-recourse to the
Company’s general assets.
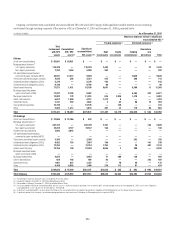
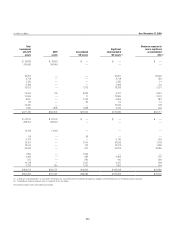
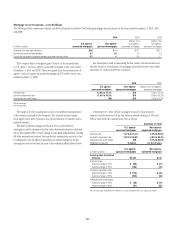
The following table presents the carrying amounts and classifications of
consolidated assets that are collateral for consolidated VIE and SPE obligations.
In billions of dollars December 31, 2010 December 31, 2009
Citicorp Citi Holdings Citigroup Citicorp Citi Holdings Citigroup
Cash $ 0.2 $ 0.6 $ 0.8 $ — $ 1.4 $ 1.4
Trading account assets 4.9 1.6 6.5 3.7 9.5 13.2
Investments 7.9 — 7.9 9.8 2.8 12.6
Total loans, net 85.3 44.7 130.0 0.1 25.0 25.1
Other 0.1 0.6 0.7 1.9 1.3 3.2
Total assets $98.4 $47.5 $145.9 $15.5 $40.0 $ 55.5
Short-term borrowings $23.1 $ 2.2 $ 25.3 $ 9.5 $ 2.6 $12.1
Long-term debt 47.6 22.1 69.7 4.6 21.2 25.8
Other liabilities 0.6 0.2 0.8 0.1 3.6 3.7
Total liabilities $71.3 $24.5 $ 95.8 $14.2 $27.4 $41.6
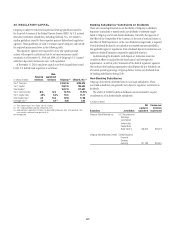
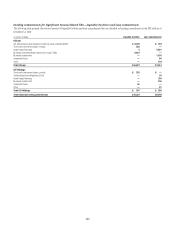
Citicorp and Citi Holdings Significant Interests in
Unconsolidated VIEs—Balance Sheet Classification
The following tables present the carrying amounts and classification of
significant interests in unconsolidated VIEs:
In billions of dollars December 31, 2010 December 31, 2009
Citicorp Citi Holdings Citigroup Citicorp Citi Holdings Citigroup
Trading account assets $ 3.6 $ 2.7 $ 6.3 $3.2 $ 3.1 $ 6.3
Investments 3.8 5.9 9.7 2.0 7.3 9.3
Loans 4.5 4.5 9.0 2.3 10.5 12.8
Other 2.7 2.0 4.7 0.5 0.1 0.6
Total assets $14.6 $15.1 $29.7 $8.0 $ 21.0 $29.0
Long-term debt $ 0.4 $ 0.5 $ 0.9 $0.5 $ — $ 0.5
Other liabilities — — — 0.3 0.2 0.5
Total liabilities $ 0.4 $ 0.5 $ 0.9 $0.8 $ 0.2 $ 1.0