Citibank 2010 Annual Report Download - page 98
Download and view the complete annual report
Please find page 98 of the 2010 Citibank annual report below. You can navigate through the pages in the report by either clicking on the pages listed below, or by using the keyword search tool below to find specific information within the annual report.-
 1
1 -
2
-
3
-
4
-
5
-
6
-
7
-
8
-
9
-
10
-
11
-
12
-
13
-
14
-
15
-
16
-
17
-
18
-
19
-
20
-
21
-
22
-
23
-
24
-
25
-
26
-
27
-
28
-
29
-
30
-
31
-
32
-
33
-
34
-
35
-
36
-
37
-
38
-
39
-
40
-
41
-
42
-
43
-
44
-
45
-
46
-
47
-
48
-
49
-
50
-
51
-
52
-
53
-
54
-
55
-
56
-
57
-
58
-
59
-
60
-
61
-
62
-
63
-
64
-
65
-
66
-
67
-
68
-
69
-
70
-
71
-
72
-
73
-
74
-
75
-
76
-
77
-
78
-
79
-
80
-
81
-
82
-
83
-
84
-
85
-
86
-
87
-
 88
88 -
 89
89 -
 90
90 -
 91
91 -
 92
92 -
 93
93 -
 94
94 -
 95
95 -
 96
96 -
 97
97 -
 98
98 -
 99
99 -
 100
100 -
 101
101 -
 102
102 -
 103
103 -
 104
104 -
 105
105 -
 106
106 -
 107
107 -
 108
108 -
109
-
110
-
111
-
112
-
113
-
114
-
115
-
116
-
117
-
118
-
119
-
120
-
121
-
122
-
123
-
124
-
125
-
126
-
127
-
128
-
129
-
130
-
131
-
132
-
133
-
134
-
135
-
136
-
137
-
138
-
139
-
140
-
141
-
142
-
143
-
144
-
145
-
146
-
147
-
148
-
149
-
150
-
151
-
152
-
153
-
154
-
155
-
156
-
157
-
158
-
159
-
160
-
161
-
162
-
163
-
164
-
165
-
166
-
167
-
168
-
169
-
170
-
171
-
172
-
173
-
174
-
175
-
176
-
177
-
178
-
179
-
180
-
181
-
182
-
183
-
184
-
185
-
186
-
187
-
188
-
189
-
190
-
191
-
192
-
193
-
194
-
195
-
196
-
197
-
198
-
199
-
200
-
201
-
202
-
203
-
204
-
205
-
206
-
207
-
208
-
209
-
210
-
211
-
212
-
213
-
214
-
215
-
216
-
217
-
218
-
219
-
220
-
221
-
222
-
223
-
224
-
225
-
226
-
227
-
228
-
229
-
230
-
231
-
232
-
233
-
234
-
235
-
236
-
237
-
238
-
239
-
240
-
241
-
242
-
243
-
244
-
245
-
246
-
247
-
248
-
249
-
250
-
251
-
252
-
253
-
254
-
255
-
256
-
257
-
258
-
259
-
260
-
261
-
262
-
263
-
264
-
265
-
266
-
267
-
268
-
269
-
270
-
271
-
272
-
273
-
274
-
275
-
276
-
277
-
278
-
279
-
280
-
281
-
282
-
283
-
284
-
285
-
286
-
287
-
288
-
289
-
290
-
291
-
292
-
293
-
294
-
295
-
296
-
297
-
298
-
299
-
300
-
301
-
302
-
303
-
304
-
305
-
306
-
307
-
308
-
309
-
310
-
311
-
312
 |
 |

96
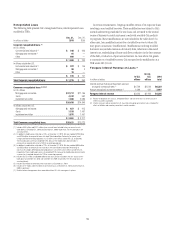
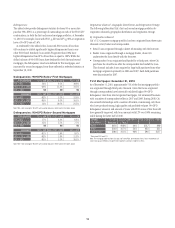
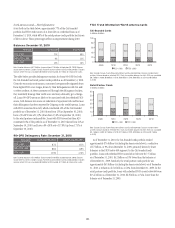
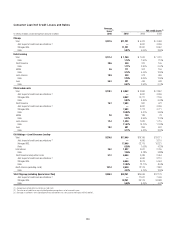
Delinquencies
The tables below provide delinquency statistics for loans 90 or more days
past due (90+DPD) as a percentage of outstandings in each of the FICO/LTV
combinations, in both the first and second mortgage portfolios, at December
31, 2010. For example, loans with FICO > 660 and LTV < 80% at origination
have a 90+DPD rate of 3.6%.
As evidenced by the tables below, loans with FICO scores of less than
620 continue to exhibit significantly higher delinquencies than in any
other FICO band. Similarly, loans with LTVs greater than 100% have
higher delinquencies than LTVs of less than or equal to 100%. While the
dollar balances of 90+DPD loans have declined for both first and second
mortgages, the delinquency rates have declined for first mortgages, and
increased for second mortgages, from those reflected in refreshed statistics at
September 30, 2010.
Delinquencies: 90+DPD Rates—First Mortgages
AT ORIGINATION FICO ≥ 660 620 ≤ FICO < 660 FICO < 620
LTV < 80% 3.6% 9.1% 10.9%
80% < LTV < 100% 6.9% 11.4% 14.5%
LTV > 100% NM NM NM
REFRESHED FICO ≥ 660 620 ≤ FICO < 660 FICO < 620
LTV ≤ 80% 0.2% 3.3% 13.5%
80% < LTV < 100% 0.5% 6.3% 18.3%
LTV > 100% 1.2% 10.7% 23.5%
Note: NM—Not meaningful. 90+DPD are based on balances referenced in the tables above.
Delinquencies: 90+DPD Rates—Second Mortgages
AT ORIGINATION FICO ≥ 660 620 ≤ FICO < 660 FICO < 620
LTV < 80% 1.7% 4.4% 6.4%
80% < LTV < 100% 3.5% 5.7% 7.7%
LTV > 100% NM NM NM
REFRESHED FICO ≥ 660 620 ≤ FICO < 660 FICO < 620
LTV ≤ 80% 0.1% 1.8% 9.7%
80% < LTV < 100% 0.2% 1.9% 11.2%
LTV > 100% 0.3% 3.3% 16.3%
Note: NM—Not meaningful. 90+DPD are based on balances referenced in the tables above.
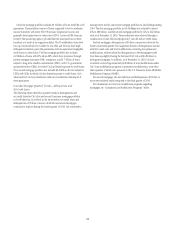
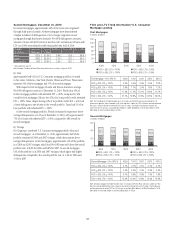
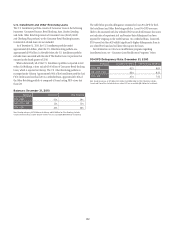
Origination Channel, Geographic Distribution and Origination Vintage
The following tables detail Citi’s first and second mortgage portfolios by
origination channels, geographic distribution and origination vintage.
By Origination Channel
Citi’s U.S. Consumer mortgage portfolio has been originated from three main
channels: retail, broker and correspondent.
Retail: loans originated through a direct relationship with the borrower.•
Broker: loans originated through a mortgage broker, where Citi •
underwrites the loan directly with the borrower.
Correspondent: loans originated and funded by a third party, where Citi •
purchases the closed loans after the correspondent has funded the loan.
This channel includes loans acquired in large bulk purchases from other
mortgage originators primarily in 2006 and 2007. Such bulk purchases
were discontinued in 2007.
First Mortgages: December 31, 2010
As of December 31, 2010, approximately 51% of the first mortgage portfolio
was originated through third-party channels. Given that loans originated
through correspondents have historically exhibited higher 90+DPD
delinquency rates than retail originated mortgages, Citi terminated business
with a number of correspondent sellers in 2007 and 2008. During 2008, Citi
also severed relationships with a number of brokers, maintaining only those
who have produced strong, high-quality and profitable volume. 90+DPD
delinquency amounts and amount of loans with FICO scores of less than 620
have generally improved, with loan amounts with LTV over 100% remaining
stable during the latter half of 2010.
CHANNEL
($ in billions)
First Lien
Mortgages
Channel
% Total
90+DPD % *FICO < 620 *LTV > 100%
Retail $43.6 49.0% 4.8% $12.7 $9.0
Broker $14.8 16.7% 5.4% $2.5 $5.3
Correspondent $30.6 34.3% 9.0% $9.6 $12.7
* Refreshed FICO and LTV.
Note: First mortgage table excludes Canada and Puerto Rico, deferred fees/costs, loans recorded at fair
value, loans guaranteed by U.S. government agencies and loans subject to LTSCs.