Citibank 2010 Annual Report Download - page 155
Download and view the complete annual report
Please find page 155 of the 2010 Citibank annual report below. You can navigate through the pages in the report by either clicking on the pages listed below, or by using the keyword search tool below to find specific information within the annual report.-
 1
1 -
2
-
3
-
4
-
5
-
6
-
7
-
8
-
9
-
10
-
11
-
12
-
13
-
14
-
15
-
16
-
17
-
18
-
19
-
20
-
21
-
22
-
23
-
24
-
25
-
26
-
27
-
28
-
29
-
30
-
31
-
32
-
33
-
34
-
35
-
36
-
37
-
38
-
39
-
40
-
41
-
42
-
43
-
44
-
45
-
46
-
47
-
48
-
49
-
50
-
51
-
52
-
53
-
54
-
55
-
56
-
57
-
58
-
59
-
60
-
61
-
62
-
63
-
64
-
65
-
66
-
67
-
68
-
69
-
70
-
71
-
72
-
73
-
74
-
75
-
76
-
77
-
78
-
79
-
80
-
81
-
82
-
83
-
84
-
85
-
86
-
87
-
88
-
89
-
90
-
91
-
92
-
93
-
94
-
95
-
96
-
97
-
98
-
99
-
100
-
101
-
102
-
103
-
104
-
105
-
106
-
107
-
108
-
109
-
110
-
111
-
112
-
113
-
114
-
115
-
116
-
117
-
118
-
119
-
120
-
121
-
122
-
123
-
124
-
125
-
126
-
127
-
128
-
129
-
130
-
131
-
132
-
133
-
134
-
135
-
136
-
137
-
138
-
139
-
140
-
141
-
142
-
143
-
144
-
 145
145 -
 146
146 -
 147
147 -
 148
148 -
 149
149 -
 150
150 -
 151
151 -
 152
152 -
 153
153 -
 154
154 -
 155
155 -
 156
156 -
 157
157 -
 158
158 -
 159
159 -
 160
160 -
 161
161 -
 162
162 -
 163
163 -
 164
164 -
 165
165 -
166
-
167
-
168
-
169
-
170
-
171
-
172
-
173
-
174
-
175
-
176
-
177
-
178
-
179
-
180
-
181
-
182
-
183
-
184
-
185
-
186
-
187
-
188
-
189
-
190
-
191
-
192
-
193
-
194
-
195
-
196
-
197
-
198
-
199
-
200
-
201
-
202
-
203
-
204
-
205
-
206
-
207
-
208
-
209
-
210
-
211
-
212
-
213
-
214
-
215
-
216
-
217
-
218
-
219
-
220
-
221
-
222
-
223
-
224
-
225
-
226
-
227
-
228
-
229
-
230
-
231
-
232
-
233
-
234
-
235
-
236
-
237
-
238
-
239
-
240
-
241
-
242
-
243
-
244
-
245
-
246
-
247
-
248
-
249
-
250
-
251
-
252
-
253
-
254
-
255
-
256
-
257
-
258
-
259
-
260
-
261
-
262
-
263
-
264
-
265
-
266
-
267
-
268
-
269
-
270
-
271
-
272
-
273
-
274
-
275
-
276
-
277
-
278
-
279
-
280
-
281
-
282
-
283
-
284
-
285
-
286
-
287
-
288
-
289
-
290
-
291
-
292
-
293
-
294
-
295
-
296
-
297
-
298
-
299
-
300
-
301
-
302
-
303
-
304
-
305
-
306
-
307
-
308
-
309
-
310
-
311
-
312
 |
 |

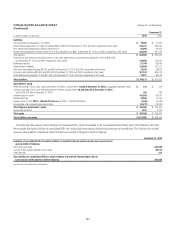
153
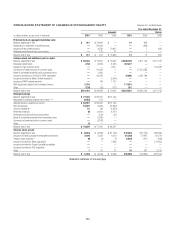
CONSOLIDATED BALANCE SHEET Citigroup Inc. and Subsidiaries
(Continued)
December 31,
In millions of dollars, except shares 2010 2009
Liabilities
Non-interest-bearing deposits in U.S. offices $ 78,268 $ 71,325
Interest-bearing deposits in U.S. offices (including $665 and $700 at December 31, 2010 and 2009, respectively, at fair value) 225,731 232,093
Non-interest-bearing deposits in offices outside the U.S. 55,066 44,904
Interest-bearing deposits in offices outside the U.S. (including $600 and $845 at December 31, 2010 and 2009, respectively, at fair value) 485,903 487,581
Total deposits $ 844,968 $ 835,903
Federal funds purchased and securities loaned or sold under agreements to repurchase (including $121,193 and $104,030
as of December 31, 2010 and 2009, respectively, at fair value) 189,558 154,281
Brokerage payables 51,749 60,846
Trading account liabilities 129,054 137,512
Short-term borrowings (including $2,429 and $639 at December 31, 2010 and 2009, respectively, at fair value) 78,790 68,879
Long-term debt (including $25,997 and $25,942 at December 31, 2010 and 2009, respectively, at fair value) 381,183 364,019
Other liabilities (including $9,710 and $11,542 as of December 31, 2010 and 2009, respectively, at fair value) 72,811 80,233
Total liabilities $1,748,113 $1,701,673
Stockholders’ equity
Preferred stock ($1.00 par value; authorized shares: 30 million), issued shares: 12,038 at December 31, 2010, at aggregate liquidation value $ 312 $ 312
Common stock ($0.01 par value; authorized shares: 60 billion), issued shares: 29,224,016,234 at December 31, 2010
and 28,626,100,389 at December 31, 2009 292 286
Additional paid-in capital 101,024 98,142
Retained earnings 79,559 77,440
Treasury stock, at cost: 2010—165,655,721 shares and 2009—142,833,099 shares (1,442) (4,543)
Accumulated other comprehensive income (loss) (16,277) (18,937)
Total Citigroup stockholders’ equity $ 163,468 $ 152,700
Noncontrolling interest 2,321 2,273
Total equity $ 165,789 $ 154,973
Total liabilities and equity $1,913,902 $1,856,646
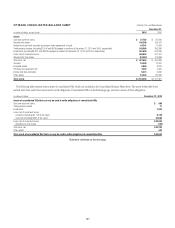
The following table presents certain liabilities of consolidated VIEs, which are included in the Consolidated Balance Sheet above. The liabilities in the table
below include third-party liabilities of consolidated VIEs only, and exclude intercompany balances that eliminate in consolidation. The liabilities also exclude
amounts where creditors or beneficial interest holders have recourse to the general credit of Citigroup.
December 31, 2010
Liabilities of consolidated VIEs for which creditors or beneficial interest holders do not have recourse to the
general credit of Citigroup
Short-term borrowings $22,046
Long-term debt (including $3,942 at fair value) 69,710
Other liabilities 813
Total liabilities of consolidated VIEs for which creditors or beneficial interest holders do not
have recourse to the general credit of Citigroup $92,569
See Notes to the Consolidated Financial Statements.