Citibank 2010 Annual Report Download - page 28
Download and view the complete annual report
Please find page 28 of the 2010 Citibank annual report below. You can navigate through the pages in the report by either clicking on the pages listed below, or by using the keyword search tool below to find specific information within the annual report.-
 1
1 -
2
-
3
-
4
-
5
-
6
-
7
-
8
-
9
-
10
-
11
-
12
-
13
-
14
-
15
-
16
-
17
-
 18
18 -
 19
19 -
 20
20 -
 21
21 -
 22
22 -
 23
23 -
 24
24 -
 25
25 -
 26
26 -
 27
27 -
 28
28 -
 29
29 -
 30
30 -
 31
31 -
 32
32 -
 33
33 -
 34
34 -
 35
35 -
 36
36 -
 37
37 -
 38
38 -
39
-
40
-
41
-
42
-
43
-
44
-
45
-
46
-
47
-
48
-
49
-
50
-
51
-
52
-
53
-
54
-
55
-
56
-
57
-
58
-
59
-
60
-
61
-
62
-
63
-
64
-
65
-
66
-
67
-
68
-
69
-
70
-
71
-
72
-
73
-
74
-
75
-
76
-
77
-
78
-
79
-
80
-
81
-
82
-
83
-
84
-
85
-
86
-
87
-
88
-
89
-
90
-
91
-
92
-
93
-
94
-
95
-
96
-
97
-
98
-
99
-
100
-
101
-
102
-
103
-
104
-
105
-
106
-
107
-
108
-
109
-
110
-
111
-
112
-
113
-
114
-
115
-
116
-
117
-
118
-
119
-
120
-
121
-
122
-
123
-
124
-
125
-
126
-
127
-
128
-
129
-
130
-
131
-
132
-
133
-
134
-
135
-
136
-
137
-
138
-
139
-
140
-
141
-
142
-
143
-
144
-
145
-
146
-
147
-
148
-
149
-
150
-
151
-
152
-
153
-
154
-
155
-
156
-
157
-
158
-
159
-
160
-
161
-
162
-
163
-
164
-
165
-
166
-
167
-
168
-
169
-
170
-
171
-
172
-
173
-
174
-
175
-
176
-
177
-
178
-
179
-
180
-
181
-
182
-
183
-
184
-
185
-
186
-
187
-
188
-
189
-
190
-
191
-
192
-
193
-
194
-
195
-
196
-
197
-
198
-
199
-
200
-
201
-
202
-
203
-
204
-
205
-
206
-
207
-
208
-
209
-
210
-
211
-
212
-
213
-
214
-
215
-
216
-
217
-
218
-
219
-
220
-
221
-
222
-
223
-
224
-
225
-
226
-
227
-
228
-
229
-
230
-
231
-
232
-
233
-
234
-
235
-
236
-
237
-
238
-
239
-
240
-
241
-
242
-
243
-
244
-
245
-
246
-
247
-
248
-
249
-
250
-
251
-
252
-
253
-
254
-
255
-
256
-
257
-
258
-
259
-
260
-
261
-
262
-
263
-
264
-
265
-
266
-
267
-
268
-
269
-
270
-
271
-
272
-
273
-
274
-
275
-
276
-
277
-
278
-
279
-
280
-
281
-
282
-
283
-
284
-
285
-
286
-
287
-
288
-
289
-
290
-
291
-
292
-
293
-
294
-
295
-
296
-
297
-
298
-
299
-
300
-
301
-
302
-
303
-
304
-
305
-
306
-
307
-
308
-
309
-
310
-
311
-
312
 |
 |
26
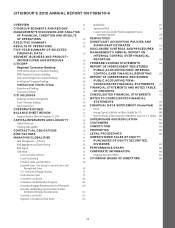
MANAGEMENT’S DISCUSSION AND ANALYSIS OF FINANCIAL CONDITION AND
RESULTS OF OPERATIONS
EXECUTIVE SUMMARY
2010 Summary Results
During 2010, Citi continued to execute its strategy of growing and investing
in its core businesses in Citicorp—Regional Consumer Banking, Securities
and Banking and Transaction Services—while at the same time winding
down the assets and businesses in Citi Holdings in an economically
rational manner.
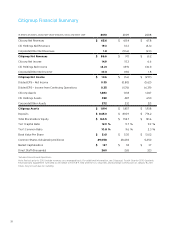
Citigroup
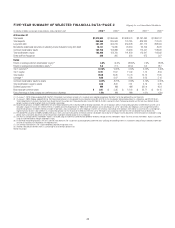
Citigroup reported net income for 2010 of $10.6 billion, compared to a net
loss of $1.6 billion in 2009. Diluted EPS was $0.35 per share in 2010 versus
a loss of $0.80 per share in 2009, and net revenues were $86.6 billion in
2010, versus $91.1 billion in 2009, on a comparable basis. On a reported
basis, net interest revenue increased by $5.7 billion, or 12%, to $54.7 billion
in 2010, generally as a result of the adoption of SFAS 166/167, partially
offset by the continued run-off of higher-yielding assets in Citi Holdings and
investments in lower-yielding securities. Non-interest revenues improved by
approximately $578 million, or 2%, to $31.9 billion in 2010, primarily due
to positive gross revenue marks in the Special Asset Pool in Citi Holdings of
$2.0 billion in 2010 versus negative revenue marks of $4.6 billion in 2009, a
$11.1 billion gain in 2009 on the sale of Smith Barney, a $1.4 billion pretax
gain related to the public and private exchange offers consummated in July
and September of 2009, and a $10.1 billion pretax loss associated with the
repayment of TARP and the exit from the loss-sharing agreement with the
U.S. government in December 2009.
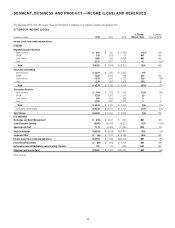
Citicorp
Despite continued weaker market conditions, Citicorp net income remained
strong in 2010 at $14.9 billion versus $15.3 billion in 2009, with earnings
in Asia and Latin America contributing more than half of the total. The
continued strength of the core Citi franchise was demonstrated by Citicorp
revenues of $65.6 billion for 2010, with a 3% growth in revenues in Regional
Consumer Banking on a comparable basis and a 3% growth in Transaction
Services, offset by lower revenues in Securities and Banking.
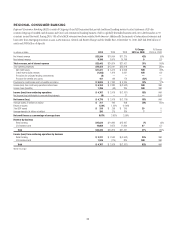
Business drivers in international Regional Consumer Banking reflected
the impact in 2010 of the accelerating pace of economic recovery in regions
outside of North America and increased investment spending by Citi:
Revenues of $17.7 billion were up 9% year over year.•
Net income more than doubled to $4.2 billion.•
Average deposits and average loans each grew by 12% year over year.•
Card purchase sales grew 17% year over year. •
Securities and Banking revenues declined 15% to $23.1 billion in 2010.
Excluding the impact of credit value adjustments (CVA), revenues were down
19% year over year to $23.5 billion. The decrease mainly reflected the impact
of lower overall client market activity and more challenging global capital
market conditions in 2010, as compared to 2009, which was a particularly
strong year driven by robust fixed income markets and higher client activity
levels in investment banking, especially in the first half of the year.
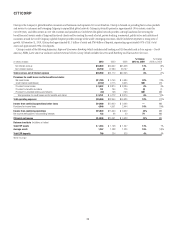
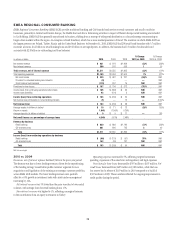
Citi Holdings
Citi Holdings’ net loss decreased 52%, from $8.9 billion to $4.2 billion, as
compared to 2009. Lower revenues reflected the absence of the $11.1 billion
pretax gain on the sale of Smith Barney in 2009 as well as a declining loan
balance resulting mainly from asset sales and net paydowns.
Citi Holdings assets stood at $359 billion at the end of 2010, down
$128 billion, or 26%, from $487 billion at the end of 2009. Adjusting for the
impact of adopting SFAS 166/167, which added approximately $43 billion of
assets to the balance sheet on January 1, 2010, Citi Holdings assets were down
by $171 billion during 2010, consisting of approximately:
$108 billion in asset sales and business dispositions; •
$50 billion of net run-off and paydowns; and •
$13 billion of net cost of credit and net asset marks. •
As of December 31, 2010, Citi Holdings represented 19% of Citigroup
assets, as compared to 38% in the first quarter of 2008. At December 31, 2010,
Citi Holdings risk-weighted assets were approximately $330 billion, or 34%, of
total Citigroup risk-weighted assets.
Credit Costs
Global credit continued to recover with the sixth consecutive quarter of
sustained improvement in credit costs in the fourth quarter of 2010. For
the full year, Citigroup net credit losses declined $11.4 billion, or 27%, to
$30.9 billion in 2010 on a comparable basis, reflecting improvement in
net credit losses in every region. During 2010, Citi released $5.8 billion in
net reserves for loan losses and unfunded lending commitments, primarily
driven by international Regional Consumer Banking, retail partner cards
in Local Consumer Lending and the Corporate loan portfolio, while it built
$8.3 billion of reserves in 2009. The total provision for credit losses and for
benefits and claims of $26.0 billion in 2010 decreased 50% on a comparable
basis year over year.
Net credit losses in Citicorp declined 10% year-over-year on a comparable
basis to $11.8 billion, and Citicorp released $2.2 billion in net reserves for
loan losses and unfunded lending commitments, compared to a $2.9 billion
reserve build in 2009. Net credit losses in Citi Holdings declined 35% on a
comparable basis to $19.1 billion, and Citi Holdings released $3.6 billion in
net reserves for loan losses and unfunded lending commitments, compared
to a $5.4 billion reserve build in 2009.