Citibank 2010 Annual Report Download - page 279
Download and view the complete annual report
Please find page 279 of the 2010 Citibank annual report below. You can navigate through the pages in the report by either clicking on the pages listed below, or by using the keyword search tool below to find specific information within the annual report.-
 1
1 -
2
-
3
-
4
-
5
-
6
-
7
-
8
-
9
-
10
-
11
-
12
-
13
-
14
-
15
-
16
-
17
-
18
-
19
-
20
-
21
-
22
-
23
-
24
-
25
-
26
-
27
-
28
-
29
-
30
-
31
-
32
-
33
-
34
-
35
-
36
-
37
-
38
-
39
-
40
-
41
-
42
-
43
-
44
-
45
-
46
-
47
-
48
-
49
-
50
-
51
-
52
-
53
-
54
-
55
-
56
-
57
-
58
-
59
-
60
-
61
-
62
-
63
-
64
-
65
-
66
-
67
-
68
-
69
-
70
-
71
-
72
-
73
-
74
-
75
-
76
-
77
-
78
-
79
-
80
-
81
-
82
-
83
-
84
-
85
-
86
-
87
-
88
-
89
-
90
-
91
-
92
-
93
-
94
-
95
-
96
-
97
-
98
-
99
-
100
-
101
-
102
-
103
-
104
-
105
-
106
-
107
-
108
-
109
-
110
-
111
-
112
-
113
-
114
-
115
-
116
-
117
-
118
-
119
-
120
-
121
-
122
-
123
-
124
-
125
-
126
-
127
-
128
-
129
-
130
-
131
-
132
-
133
-
134
-
135
-
136
-
137
-
138
-
139
-
140
-
141
-
142
-
143
-
144
-
145
-
146
-
147
-
148
-
149
-
150
-
151
-
152
-
153
-
154
-
155
-
156
-
157
-
158
-
159
-
160
-
161
-
162
-
163
-
164
-
165
-
166
-
167
-
168
-
169
-
170
-
171
-
172
-
173
-
174
-
175
-
176
-
177
-
178
-
179
-
180
-
181
-
182
-
183
-
184
-
185
-
186
-
187
-
188
-
189
-
190
-
191
-
192
-
193
-
194
-
195
-
196
-
197
-
198
-
199
-
200
-
201
-
202
-
203
-
204
-
205
-
206
-
207
-
208
-
209
-
210
-
211
-
212
-
213
-
214
-
215
-
216
-
217
-
218
-
219
-
220
-
221
-
222
-
223
-
224
-
225
-
226
-
227
-
228
-
229
-
230
-
231
-
232
-
233
-
234
-
235
-
236
-
237
-
238
-
239
-
240
-
241
-
242
-
243
-
244
-
245
-
246
-
247
-
248
-
249
-
250
-
251
-
252
-
253
-
254
-
255
-
256
-
257
-
258
-
259
-
260
-
261
-
262
-
263
-
264
-
265
-
266
-
267
-
268
-
 269
269 -
 270
270 -
 271
271 -
 272
272 -
 273
273 -
 274
274 -
 275
275 -
 276
276 -
 277
277 -
 278
278 -
 279
279 -
 280
280 -
 281
281 -
 282
282 -
 283
283 -
 284
284 -
 285
285 -
 286
286 -
 287
287 -
 288
288 -
 289
289 -
290
-
291
-
292
-
293
-
294
-
295
-
296
-
297
-
298
-
299
-
300
-
301
-
302
-
303
-
304
-
305
-
306
-
307
-
308
-
309
-
310
-
311
-
312
 |
 |

277
28. PLEDGED SECURITIES, COLLATERAL,
COMMITMENTS AND GUARANTEES
Pledged Securities
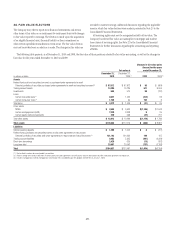
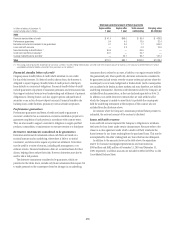
At December 31, 2010 and 2009, the approximate fair values of securities sold
under agreements to repurchase and other securities pledged, excluding the
impact of allowable netting, were as follows:
In millions of dollars 2010 2009
For securities sold under agreements to repurchase $227,967 $237,707
As collateral for securities borrowed for approximately
equivalent value 40,741 44,095
As collateral on bank loans 196,477 188,160
To clearing organizations or segregated under securities laws
and regulations 21,466 21,385
For securities loaned 37,965 36,767
Other 15,136 30,000
Total $539,752 $558,114
In addition, included in cash and due from banks at December 31, 2010
and 2009 are $15.6 billion and $11.2 billion, respectively, of cash segregated
under federal and other brokerage regulations or deposited with clearing
organizations.
At December 31, 2010 and 2009, the Company had $1.1 billion and
$1.9 billion, respectively, of outstanding letters of credit from third-party
banks to satisfy various collateral and margin requirements.
Collateral
At December 31, 2010 and 2009, the approximate market value of collateral
received by the Company that may be sold or repledged by the Company,
excluding the impact of allowable netting, was $335.3 billion and
$346.2 billion, respectively. This collateral was received in connection with
resale agreements, securities borrowings and loans, derivative transactions
and margined broker loans.
At December 31, 2010 and 2009, a substantial portion of the collateral
received by the Company had been sold or repledged in connection with
repurchase agreements, securities sold, not yet purchased, securities
borrowings and loans, pledges to clearing organizations, segregation
requirements under securities laws and regulations, derivative transactions
and bank loans.
In addition, at December 31, 2010 and 2009, the Company had pledged
$246 billion and $253 billion, respectively, of collateral that may not be sold
or repledged by the secured parties.
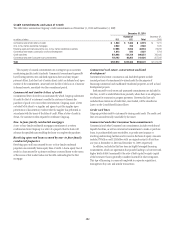
Lease Commitments
Rental expense (principally for offices and computer equipment) was
$1.6 billion, $2.0 billion and $2.7 billion for the years ended December 31,
2010, 2009 and 2008, respectively.
Future minimum annual rentals under noncancelable leases, net of
sublease income, are as follows:
In millions of dollars
2011 $1,137
2012 1,030
2013 939
2014 856
2015 763
Thereafter 2,440
Total $7,165
Guarantees
The Company provides a variety of guarantees and indemnifications to
Citigroup customers to enhance their credit standing and enable them
to complete a wide variety of business transactions. For certain contracts
meeting the definition of a guarantee, the guarantor must recognize, at
inception, a liability for the fair value of the obligation undertaken in issuing
the guarantee.
In addition, the guarantor must disclose the maximum potential
amount of future payments the guarantor could be required to make under
the guarantee, if there were a total default by the guaranteed parties. The
determination of the maximum potential future payments is based on
the notional amount of the guarantees without consideration of possible
recoveries under recourse provisions or from collateral held or pledged.
Such amounts bear no relationship to the anticipated losses, if any, on
these guarantees.
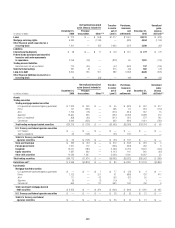
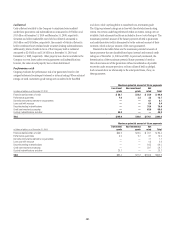
The following tables present information about the Company’s guarantees at December 31, 2010 and December 31, 2009:
Maximum potential amount of future payments
In billions of dollars at December 31,
except carrying value in millions
Expire within
1 year
Expire after
1 year
Total amount
outstanding
Carrying value
(in millions)
2010
Financial standby letters of credit $ 19.5 $ 75.3 $ 94.8 $ 225.9
Performance guarantees 9.1 4.6 13.7 35.8
Derivative instruments considered to be guarantees 3.1 5.0 8.1 850.4
Loans sold with recourse — 0.4 0.4 134.3
Securities lending indemnifications (1) 70.4 — 70.4 —
Credit card merchant processing (1) 65.0 — 65.0 —
Custody indemnifications and other — 40.2 40.2 253.8
Total $167.1 $125.5 $292.6 $1,500.2
(1) The carrying values of securities lending indemnifications and credit card merchant processing are not material, as the Company has determined that the amount and probability of potential liabilities arising from these
guarantees are not significant.