Citibank 2010 Annual Report Download - page 35
Download and view the complete annual report
Please find page 35 of the 2010 Citibank annual report below. You can navigate through the pages in the report by either clicking on the pages listed below, or by using the keyword search tool below to find specific information within the annual report.-
 1
1 -
2
-
3
-
4
-
5
-
6
-
7
-
8
-
9
-
10
-
11
-
12
-
13
-
14
-
15
-
16
-
17
-
18
-
19
-
20
-
21
-
22
-
23
-
24
-
 25
25 -
 26
26 -
 27
27 -
 28
28 -
 29
29 -
 30
30 -
 31
31 -
 32
32 -
 33
33 -
 34
34 -
 35
35 -
 36
36 -
 37
37 -
 38
38 -
 39
39 -
 40
40 -
 41
41 -
 42
42 -
 43
43 -
 44
44 -
 45
45 -
46
-
47
-
48
-
49
-
50
-
51
-
52
-
53
-
54
-
55
-
56
-
57
-
58
-
59
-
60
-
61
-
62
-
63
-
64
-
65
-
66
-
67
-
68
-
69
-
70
-
71
-
72
-
73
-
74
-
75
-
76
-
77
-
78
-
79
-
80
-
81
-
82
-
83
-
84
-
85
-
86
-
87
-
88
-
89
-
90
-
91
-
92
-
93
-
94
-
95
-
96
-
97
-
98
-
99
-
100
-
101
-
102
-
103
-
104
-
105
-
106
-
107
-
108
-
109
-
110
-
111
-
112
-
113
-
114
-
115
-
116
-
117
-
118
-
119
-
120
-
121
-
122
-
123
-
124
-
125
-
126
-
127
-
128
-
129
-
130
-
131
-
132
-
133
-
134
-
135
-
136
-
137
-
138
-
139
-
140
-
141
-
142
-
143
-
144
-
145
-
146
-
147
-
148
-
149
-
150
-
151
-
152
-
153
-
154
-
155
-
156
-
157
-
158
-
159
-
160
-
161
-
162
-
163
-
164
-
165
-
166
-
167
-
168
-
169
-
170
-
171
-
172
-
173
-
174
-
175
-
176
-
177
-
178
-
179
-
180
-
181
-
182
-
183
-
184
-
185
-
186
-
187
-
188
-
189
-
190
-
191
-
192
-
193
-
194
-
195
-
196
-
197
-
198
-
199
-
200
-
201
-
202
-
203
-
204
-
205
-
206
-
207
-
208
-
209
-
210
-
211
-
212
-
213
-
214
-
215
-
216
-
217
-
218
-
219
-
220
-
221
-
222
-
223
-
224
-
225
-
226
-
227
-
228
-
229
-
230
-
231
-
232
-
233
-
234
-
235
-
236
-
237
-
238
-
239
-
240
-
241
-
242
-
243
-
244
-
245
-
246
-
247
-
248
-
249
-
250
-
251
-
252
-
253
-
254
-
255
-
256
-
257
-
258
-
259
-
260
-
261
-
262
-
263
-
264
-
265
-
266
-
267
-
268
-
269
-
270
-
271
-
272
-
273
-
274
-
275
-
276
-
277
-
278
-
279
-
280
-
281
-
282
-
283
-
284
-
285
-
286
-
287
-
288
-
289
-
290
-
291
-
292
-
293
-
294
-
295
-
296
-
297
-
298
-
299
-
300
-
301
-
302
-
303
-
304
-
305
-
306
-
307
-
308
-
309
-
310
-
311
-
312
 |
 |

33
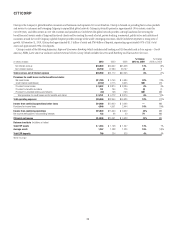
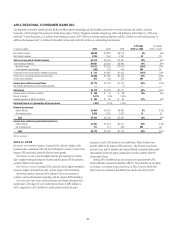
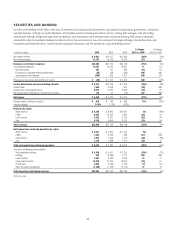
REGIONAL CONSUMER BANKING
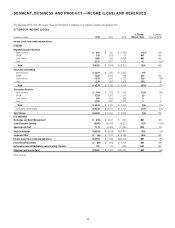
Regional Consumer Banking (RCB) consists of Citigroup’s four RCB businesses that provide traditional banking services to retail customers. RCB also
contains Citigroup’s branded cards business and Citi’s local commercial banking business. RCB is a globally diversified business with over 4,200 branches in 39
countries around the world. During 2010, 54% of total RCB revenues were from outside North America. Additionally, the majority of international revenues and
loans were from emerging economies in Asia, Latin America, Central and Eastern Europe and the Middle East. At December 31, 2010, RCB had $330 billion of
assets and $309 billion of deposits.
In millions of dollars 2010 2009 2008
% Change
2010 vs. 2009
% Change
2009 vs. 2008
Net interest revenue $23,244 $16,404 $17,275 42% (5)%
Non-interest revenue 9,198 8,410 10,146 9(17)
Total revenues, net of interest expense $32,442 $24,814 $27,421 31% (10)%
Total operating expenses $16,454 $15,041 $23,618 9% (36)%
Net credit losses $11,221 $ 5,410 $ 4,068 NM 33%
Credit reserve build (release) (1,543) 1,819 2,091 NM (13)
Provisions for unfunded lending commitments (4) — — ——
Provision for benefits and claims 151 164 176 (8)% (7)
Provisions for credit losses and for benefits and claims $ 9,825 $ 7,393 $ 6,335 33% 17%
Income (loss) from continuing operations before taxes $ 6,163 $ 2,380 $ (2,532) NM NM
Income taxes (benefits) 1,396 (98) 235 NM NM
Income (loss) from continuing operations $ 4,767 $ 2,478 $ (2,767) 92% NM
Net income (loss) attributable to noncontrolling interests (9) — 11 —(100)
Net income (loss) $ 4,776 $ 2,478 $ (2,778) 93% NM
Average assets (in billions of dollars) $ 311 242 268 29% (10)%
Return on assets 1.54% 1.02% (1.04)%
Total EOP assets $ 330 $ 256 $ 245 29 5
Average deposits (in billions of dollars) 295 275 269 72
Net credit losses as a percentage of average loans 5.07% 3.63% 2.58%
Revenue by business
Retail banking $15,834 $14,842 $15,427 7% (4)%
Citi-branded cards 16,608 9,972 11,994 67 (17)
Total $32,442 $24,814 $27,421 31% (10)%
Income (loss) from continuing operations by business
Retail banking $ 3,231 $ 2,593 $ (3,592) 25% NM
Citi-branded cards 1,536 (115) 825 NM NM
Total $ 4,767 $ 2,478 $ (2,767) 92% NM
NM Not meaningful