Citibank 2010 Annual Report Download - page 70
Download and view the complete annual report
Please find page 70 of the 2010 Citibank annual report below. You can navigate through the pages in the report by either clicking on the pages listed below, or by using the keyword search tool below to find specific information within the annual report.-
 1
1 -
2
-
3
-
4
-
5
-
6
-
7
-
8
-
9
-
10
-
11
-
12
-
13
-
14
-
15
-
16
-
17
-
18
-
19
-
20
-
21
-
22
-
23
-
24
-
25
-
26
-
27
-
28
-
29
-
30
-
31
-
32
-
33
-
34
-
35
-
36
-
37
-
38
-
39
-
40
-
41
-
42
-
43
-
44
-
45
-
46
-
47
-
48
-
49
-
50
-
51
-
52
-
53
-
54
-
55
-
56
-
57
-
58
-
59
-
 60
60 -
 61
61 -
 62
62 -
 63
63 -
 64
64 -
 65
65 -
 66
66 -
 67
67 -
 68
68 -
 69
69 -
 70
70 -
 71
71 -
 72
72 -
 73
73 -
 74
74 -
 75
75 -
 76
76 -
 77
77 -
 78
78 -
 79
79 -
 80
80 -
81
-
82
-
83
-
84
-
85
-
86
-
87
-
88
-
89
-
90
-
91
-
92
-
93
-
94
-
95
-
96
-
97
-
98
-
99
-
100
-
101
-
102
-
103
-
104
-
105
-
106
-
107
-
108
-
109
-
110
-
111
-
112
-
113
-
114
-
115
-
116
-
117
-
118
-
119
-
120
-
121
-
122
-
123
-
124
-
125
-
126
-
127
-
128
-
129
-
130
-
131
-
132
-
133
-
134
-
135
-
136
-
137
-
138
-
139
-
140
-
141
-
142
-
143
-
144
-
145
-
146
-
147
-
148
-
149
-
150
-
151
-
152
-
153
-
154
-
155
-
156
-
157
-
158
-
159
-
160
-
161
-
162
-
163
-
164
-
165
-
166
-
167
-
168
-
169
-
170
-
171
-
172
-
173
-
174
-
175
-
176
-
177
-
178
-
179
-
180
-
181
-
182
-
183
-
184
-
185
-
186
-
187
-
188
-
189
-
190
-
191
-
192
-
193
-
194
-
195
-
196
-
197
-
198
-
199
-
200
-
201
-
202
-
203
-
204
-
205
-
206
-
207
-
208
-
209
-
210
-
211
-
212
-
213
-
214
-
215
-
216
-
217
-
218
-
219
-
220
-
221
-
222
-
223
-
224
-
225
-
226
-
227
-
228
-
229
-
230
-
231
-
232
-
233
-
234
-
235
-
236
-
237
-
238
-
239
-
240
-
241
-
242
-
243
-
244
-
245
-
246
-
247
-
248
-
249
-
250
-
251
-
252
-
253
-
254
-
255
-
256
-
257
-
258
-
259
-
260
-
261
-
262
-
263
-
264
-
265
-
266
-
267
-
268
-
269
-
270
-
271
-
272
-
273
-
274
-
275
-
276
-
277
-
278
-
279
-
280
-
281
-
282
-
283
-
284
-
285
-
286
-
287
-
288
-
289
-
290
-
291
-
292
-
293
-
294
-
295
-
296
-
297
-
298
-
299
-
300
-
301
-
302
-
303
-
304
-
305
-
306
-
307
-
308
-
309
-
310
-
311
-
312
 |
 |

68
Liquidity Risk Management
Citigroup runs a centralized treasury model where the overall balance sheet
is managed by Citigroup Treasury through Global Franchise Treasurers
and Regional Treasurers. Day-to-day liquidity and funding are managed by
treasurers at the country and business level and are monitored by Corporate
Treasury and Citi risk management.
Liquidity management is the responsibility of senior management
through Citigroup’s Finance and Asset and Liability Committee (FinALCO)
and is overseen by the Board of Directors through its Risk Management
and Finance Committee. Asset and liability committees are also established
globally and for each region, country and/or major line of business.
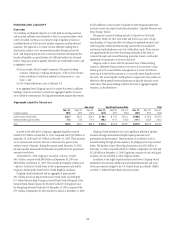
Liquidity Measures and Stress Testing
Citi uses multiple measures in monitoring its liquidity, including liquidity
ratios, stress testing and liquidity limits, each as described below.
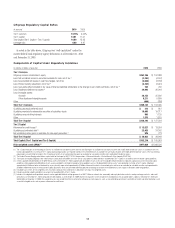
In broad terms, the structural liquidity ratio, defined as the sum of
deposits, long-term debt and stockholders’ equity as a percentage of total
assets, measures whether the asset base is funded by sufficiently long-dated
liabilities. Citi’s structural liquidity ratio was 73% at December 31, 2010, 71%
at September 30, 2010, and 73% at December 31, 2009.
Another measure of Citi’s structural liquidity is cash capital. Cash capital
is a more detailed measure of the ability to fund the structurally illiquid
portion of Citigroup’s balance sheet. Cash capital measures the amount of
long-term funding—or core customer deposits, long-term debt (over one
year) and equity—available to fund illiquid assets. Illiquid assets generally
include loans (net of securitization adjustments), securities haircuts and
other assets (i.e., goodwill, intangibles, fixed assets). At December 31, 2010,
both the non-bank and the aggregate bank subsidiaries had a significant
excess of cash capital. In addition, as of December 31, 2010, the non-bank
maintained liquidity to meet all maturing obligations significantly in excess
of a one-year period without access to the unsecured wholesale markets.
Liquidity stress testing is performed for each major entity, operating
subsidiary and/or country. Stress testing and scenario analyses are intended
to quantify the potential impact of a liquidity event on the balance sheet
and liquidity position, and to identify viable funding alternatives that can
be utilized. These scenarios include assumptions about significant changes
in key funding sources, market triggers (such as credit ratings), potential
uses of funding and political and economic conditions in certain countries.
These conditions include standard and stressed market conditions as well as
firm-specific events.
A wide range of liquidity stress tests are important for monitoring
purposes. Some span liquidity events over a full year, some may cover an
intense stress period of one month, and still other time frames may be
appropriate. These potential liquidity events are useful to ascertain potential
mis-matches between liquidity sources and uses over a variety of horizons
(overnight, one week, two week, one month, three month, one year), and
liquidity limits are set accordingly. To monitor the liquidity of a unit,
those stress tests and potential mismatches may be calculated with varying
frequencies, with several important tests performed daily.
Given the range of potential stresses, Citi maintains a series of
Contingency Funding Plans on a consolidated basis as well as for individual
entities. These plans specify a wide range of readily available actions that
are available in a variety of adverse market conditions, or idiosyncratic
disruptions.
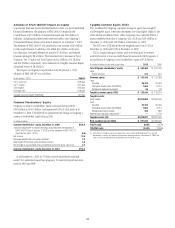
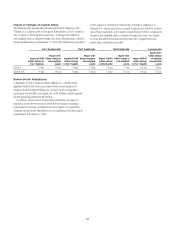
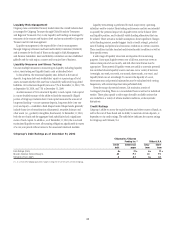
Credit Ratings
Citigroup’s ability to access the capital markets and other sources of funds, as
well as the cost of these funds and its ability to maintain certain deposits, is
dependent on its credit ratings. The table below indicates the current ratings
for Citigroup and Citibank, N.A.
Citigroup’s Debt Ratings as of December 31, 2010
Citigroup Inc./Citigroup
Funding Inc. (1) Citibank, N.A.
Senior
debt
Commercial
paper
Long-
term
Short-
term
Fitch Ratings (Fitch) A+ F1+ A+ F1+
Moody’s Investors Service (Moody’s) A3 P-1 A1 P-1
Standard & Poor’s (S&P) A A-1 A+ A-1
(1) As a result of the Citigroup guarantee, changes in ratings for CFI are the same as those of Citigroup.