Citibank 2010 Annual Report Download - page 196
Download and view the complete annual report
Please find page 196 of the 2010 Citibank annual report below. You can navigate through the pages in the report by either clicking on the pages listed below, or by using the keyword search tool below to find specific information within the annual report.-
 1
1 -
2
-
3
-
4
-
5
-
6
-
7
-
8
-
9
-
10
-
11
-
12
-
13
-
14
-
15
-
16
-
17
-
18
-
19
-
20
-
21
-
22
-
23
-
24
-
25
-
26
-
27
-
28
-
29
-
30
-
31
-
32
-
33
-
34
-
35
-
36
-
37
-
38
-
39
-
40
-
41
-
42
-
43
-
44
-
45
-
46
-
47
-
48
-
49
-
50
-
51
-
52
-
53
-
54
-
55
-
56
-
57
-
58
-
59
-
60
-
61
-
62
-
63
-
64
-
65
-
66
-
67
-
68
-
69
-
70
-
71
-
72
-
73
-
74
-
75
-
76
-
77
-
78
-
79
-
80
-
81
-
82
-
83
-
84
-
85
-
86
-
87
-
88
-
89
-
90
-
91
-
92
-
93
-
94
-
95
-
96
-
97
-
98
-
99
-
100
-
101
-
102
-
103
-
104
-
105
-
106
-
107
-
108
-
109
-
110
-
111
-
112
-
113
-
114
-
115
-
116
-
117
-
118
-
119
-
120
-
121
-
122
-
123
-
124
-
125
-
126
-
127
-
128
-
129
-
130
-
131
-
132
-
133
-
134
-
135
-
136
-
137
-
138
-
139
-
140
-
141
-
142
-
143
-
144
-
145
-
146
-
147
-
148
-
149
-
150
-
151
-
152
-
153
-
154
-
155
-
156
-
157
-
158
-
159
-
160
-
161
-
162
-
163
-
164
-
165
-
166
-
167
-
168
-
169
-
170
-
171
-
172
-
173
-
174
-
175
-
176
-
177
-
178
-
179
-
180
-
181
-
182
-
183
-
184
-
185
-
 186
186 -
 187
187 -
 188
188 -
 189
189 -
 190
190 -
 191
191 -
 192
192 -
 193
193 -
 194
194 -
 195
195 -
 196
196 -
 197
197 -
 198
198 -
 199
199 -
 200
200 -
 201
201 -
 202
202 -
 203
203 -
 204
204 -
 205
205 -
 206
206 -
207
-
208
-
209
-
210
-
211
-
212
-
213
-
214
-
215
-
216
-
217
-
218
-
219
-
220
-
221
-
222
-
223
-
224
-
225
-
226
-
227
-
228
-
229
-
230
-
231
-
232
-
233
-
234
-
235
-
236
-
237
-
238
-
239
-
240
-
241
-
242
-
243
-
244
-
245
-
246
-
247
-
248
-
249
-
250
-
251
-
252
-
253
-
254
-
255
-
256
-
257
-
258
-
259
-
260
-
261
-
262
-
263
-
264
-
265
-
266
-
267
-
268
-
269
-
270
-
271
-
272
-
273
-
274
-
275
-
276
-
277
-
278
-
279
-
280
-
281
-
282
-
283
-
284
-
285
-
286
-
287
-
288
-
289
-
290
-
291
-
292
-
293
-
294
-
295
-
296
-
297
-
298
-
299
-
300
-
301
-
302
-
303
-
304
-
305
-
306
-
307
-
308
-
309
-
310
-
311
-
312
 |
 |

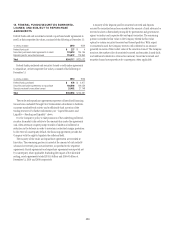
194
A one-percentage-point change in the discount rates would have the following effects on pension expense:
One-percentage-point increase One-percentage-point decrease
In millions of dollars 2010 2009 2008 2010 2009 2008
Effect on pension expense for U.S. plans (1) $ 19 $ 14 $ 36 $(34) $(27) $(24)
Effect on pension expense for non-U.S. plans (49) (40) (58) 56 62 94
Assumed health-care cost-trend rates were as follows:
2010 2009
Health-care cost increase rate U.S. plans
Following year 9.50% 8.00%
Ultimate rate to which cost increase is assumed
to decline 5.00 5.00
Year in which the ultimate rate is reached 2020 2016
A one-percentage-point change in assumed health-care cost-trend rates
would have the following effects:
One-percentage-
point increase
One-percentage-
point decrease
In millions of dollars 2010 2009 2010 2009
Effect on benefits earned and interest cost
for U.S. plans $ 3 $ 3 $ (2) $ (3)
Effect on accumulated postretirement
benefit obligation for U.S. plans 49 60 (44) (49)
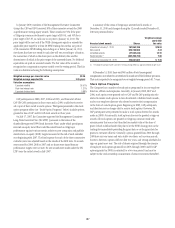
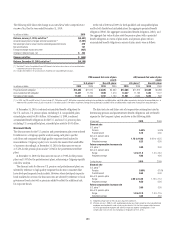
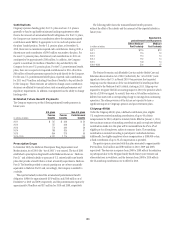
Expected Rate of Return
Citigroup determines its assumptions for the expected rate of return on plan
assets for its U.S. pension and postretirement plans using a “building block”
approach, which focuses on ranges of anticipated rates of return for each
asset class. A weighted range of nominal rates is then determined based on
target allocations to each asset class. Market performance over a number of
earlier years is evaluated covering a wide range of economic conditions to
determine whether there are sound reasons for projecting any past trends.
Citigroup considers the expected rate of return to be a long-term
assessment of return expectations and does not anticipate changing this
assumption annually unless there are significant changes in investment
strategy or economic conditions. This contrasts with the selection of
the discount rate, future compensation increase rate, and certain other
assumptions, which are reconsidered annually in accordance with generally
accepted accounting principles.
The expected rate of return for the U.S. pension and post-retirement plans
was 7.5% at December 31, 2010, 7.75% at December 31, 2009 and 7.75% at
December 31, 2008, reflecting a change in investment allocations. Actual
returns in 2010 were more than the expected returns, while actual returns
in 2009 and 2008 were less than the expected returns. This expected amount
reflects the expected annual appreciation of the plan assets and reduces
the annual pension expense of Citigroup. It is deducted from the sum of
service cost, interest and other components of pension expense to arrive at
the net pension (benefit) expense. Net pension (benefit) expense for the U.S.
pension plans for 2010, 2009 and 2008 reflects deductions of $874 million,
$912 million and $949 million of expected returns, respectively.
The following table shows the expected versus actual rate of return on
plan assets for the U.S. pension and postretirement plans:
2010 2009 2008
Expected rate of return (1) 7.75% 7.75% 7.75%
Actual rate of return (2) 14.11% (2.77)% (5.42)%
(1) As of December 31, 2010, the Company lowered its expected rate of return to 7.5%.
(2) Actual rates of return are presented gross of fees.
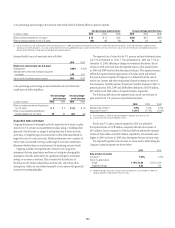
For the non-U.S. plans, pension expense for 2010 was reduced by
the expected return of $378 million, compared with the actual return of
$432 million. Pension expense for 2009 and 2008 was reduced by expected
returns of $336 million and $487 million, respectively. Actual returns were
higher in 2009, but lower in 2008, than the expected returns in those years.
The expected long-term rates of return on assets used in determining the
Company’s pension expense are shown below:
2010 2009
Rate of return on assets
U.S. plans (1) 7.50% 7.75%
Non-U.S. pension plans
Range 1.75 to 13.00 2.50 to 13.00
Weighted average 6.96 7.31
(1) Weighted-average rates for the U.S. plans equal the stated rates. As of December 31, 2010, the
Company lowered its expected rate of return to 7.50%.
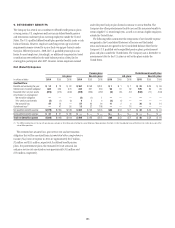
(1) Due to the freeze of the U.S. qualified pension plan commencing January 1, 2008, the majority of the prospective service cost has been eliminated and the gain/loss amortization period was changed to the life
expectancy for inactive participants. As a result, pension expense for the U.S. qualified pension plan is driven more by interest costs than service costs, and an increase in the discount rate would increase pension
expense, while a decrease in the discount rate would decrease pension expense.