Citibank 2010 Annual Report Download - page 185
Download and view the complete annual report
Please find page 185 of the 2010 Citibank annual report below. You can navigate through the pages in the report by either clicking on the pages listed below, or by using the keyword search tool below to find specific information within the annual report.-
 1
1 -
2
-
3
-
4
-
5
-
6
-
7
-
8
-
9
-
10
-
11
-
12
-
13
-
14
-
15
-
16
-
17
-
18
-
19
-
20
-
21
-
22
-
23
-
24
-
25
-
26
-
27
-
28
-
29
-
30
-
31
-
32
-
33
-
34
-
35
-
36
-
37
-
38
-
39
-
40
-
41
-
42
-
43
-
44
-
45
-
46
-
47
-
48
-
49
-
50
-
51
-
52
-
53
-
54
-
55
-
56
-
57
-
58
-
59
-
60
-
61
-
62
-
63
-
64
-
65
-
66
-
67
-
68
-
69
-
70
-
71
-
72
-
73
-
74
-
75
-
76
-
77
-
78
-
79
-
80
-
81
-
82
-
83
-
84
-
85
-
86
-
87
-
88
-
89
-
90
-
91
-
92
-
93
-
94
-
95
-
96
-
97
-
98
-
99
-
100
-
101
-
102
-
103
-
104
-
105
-
106
-
107
-
108
-
109
-
110
-
111
-
112
-
113
-
114
-
115
-
116
-
117
-
118
-
119
-
120
-
121
-
122
-
123
-
124
-
125
-
126
-
127
-
128
-
129
-
130
-
131
-
132
-
133
-
134
-
135
-
136
-
137
-
138
-
139
-
140
-
141
-
142
-
143
-
144
-
145
-
146
-
147
-
148
-
149
-
150
-
151
-
152
-
153
-
154
-
155
-
156
-
157
-
158
-
159
-
160
-
161
-
162
-
163
-
164
-
165
-
166
-
167
-
168
-
169
-
170
-
171
-
172
-
173
-
174
-
 175
175 -
 176
176 -
 177
177 -
 178
178 -
 179
179 -
 180
180 -
 181
181 -
 182
182 -
 183
183 -
 184
184 -
 185
185 -
 186
186 -
 187
187 -
 188
188 -
 189
189 -
 190
190 -
 191
191 -
 192
192 -
 193
193 -
 194
194 -
 195
195 -
196
-
197
-
198
-
199
-
200
-
201
-
202
-
203
-
204
-
205
-
206
-
207
-
208
-
209
-
210
-
211
-
212
-
213
-
214
-
215
-
216
-
217
-
218
-
219
-
220
-
221
-
222
-
223
-
224
-
225
-
226
-
227
-
228
-
229
-
230
-
231
-
232
-
233
-
234
-
235
-
236
-
237
-
238
-
239
-
240
-
241
-
242
-
243
-
244
-
245
-
246
-
247
-
248
-
249
-
250
-
251
-
252
-
253
-
254
-
255
-
256
-
257
-
258
-
259
-
260
-
261
-
262
-
263
-
264
-
265
-
266
-
267
-
268
-
269
-
270
-
271
-
272
-
273
-
274
-
275
-
276
-
277
-
278
-
279
-
280
-
281
-
282
-
283
-
284
-
285
-
286
-
287
-
288
-
289
-
290
-
291
-
292
-
293
-
294
-
295
-
296
-
297
-
298
-
299
-
300
-
301
-
302
-
303
-
304
-
305
-
306
-
307
-
308
-
309
-
310
-
311
-
312
 |
 |

183
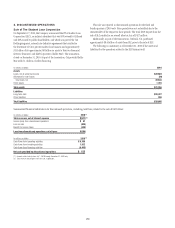
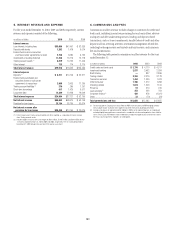
5. INTEREST REVENUE AND EXPENSE
For the years ended December 31, 2010, 2009 and 2008, respectively, interest
revenue and expense consisted of the following:
In millions of dollars 2010 2009 2008
Interest revenue
Loan interest, including fees $55,056 $47,457 $ 62,336
Deposits with banks 1,252 1,478 3,074
Federal funds sold and securities
purchased under agreements to resell 3,156 3,084 9,150
Investments, including dividends 11,238 13,119 10,718
Trading account assets (1) 8,079 10,723 17,446
Other interest 735 774 3,775
Total interest revenue $79,516 $76,635 $106,499
Interest expense
Deposits (2) $ 8,371 $10,146 $ 20,271
Federal funds purchased and
securities loaned or sold under
agreements to repurchase 2,808 3,433 11,265
Trading account liabilities (1) 379 289 1,257
Short-term borrowings 917 1,425 3,911
Long-term debt 12,389 12,428 16,046
Total interest expense $24,864 $27,721 $ 52,750
Net interest revenue $54,652 $48,914 $ 53,749
Provision for loan losses 25,194 38,760 33,674
Net interest revenue after
provision for loan losses $29,458 $10,154 $ 20,075
(1) Interest expense on Trading account liabilities of ICG is reported as a reduction of interest revenue
from Trading account assets.
(2) Includes deposit insurance fees and charges of $981 million, $1,467 million and $394 million for the
12 months ended December 31, 2010, 2009 and 2008, respectively. The 12-month period ended
December 31, 2009 includes the one-time FDIC special assessment.
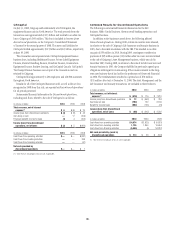
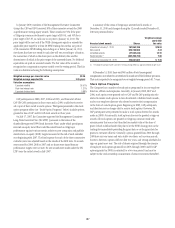
6. COMMISSIONS AND FEES
Commissions and fees revenue includes charges to customers for credit and
bank cards, including transaction processing fees and annual fees; advisory
and equity and debt underwriting services; lending and deposit-related
transactions, such as loan commitments, standby letters of credit and other
deposit and loan servicing activities; investment management-related fees,
including brokerage services and custody and trust services; and insurance
fees and commissions.
The following table presents commissions and fees revenue for the years
ended December 31:
In millions of dollars 2010 2009 2008
Credit cards and bank cards $ 3,774 $ 4,110 $ 4,517
Investment banking 2,977 3,462 2,284
Smith Barney —837 2,836
Trading-related 2,368 2,316 3,178
Transaction services 1,454 1,306 1,423
Other Consumer 1,156 1,272 1,283
Checking-related 1,023 1,043 1,134
Primerica 91 314 416
Loan servicing (1) 353 226 759
Corporate finance (2) 439 678 (4,921)
Other 23 (79) (54)
Total commissions and fees $13,658 $15,485 $12,855
(1) For clarity purposes, Citigroup has reclassified the MSR mark to market and MSR hedging activities
from multiple income statement lines together into Other revenue for all periods presented.
(2) Includes write-downs of approximately $4.9 billion in 2008, net of underwriting fees, on funded and
unfunded highly leveraged finance commitments, recorded at fair value and reported as loans held for
sale in Other assets. Write-downs were recorded on all highly leveraged finance commitments where
there was value impairment, regardless of funding date.