Citibank 2010 Annual Report Download - page 33
Download and view the complete annual report
Please find page 33 of the 2010 Citibank annual report below. You can navigate through the pages in the report by either clicking on the pages listed below, or by using the keyword search tool below to find specific information within the annual report.-
 1
1 -
2
-
3
-
4
-
5
-
6
-
7
-
8
-
9
-
10
-
11
-
12
-
13
-
14
-
15
-
16
-
17
-
18
-
19
-
20
-
21
-
22
-
 23
23 -
 24
24 -
 25
25 -
 26
26 -
 27
27 -
 28
28 -
 29
29 -
 30
30 -
 31
31 -
 32
32 -
 33
33 -
 34
34 -
 35
35 -
 36
36 -
 37
37 -
 38
38 -
 39
39 -
 40
40 -
 41
41 -
 42
42 -
 43
43 -
44
-
45
-
46
-
47
-
48
-
49
-
50
-
51
-
52
-
53
-
54
-
55
-
56
-
57
-
58
-
59
-
60
-
61
-
62
-
63
-
64
-
65
-
66
-
67
-
68
-
69
-
70
-
71
-
72
-
73
-
74
-
75
-
76
-
77
-
78
-
79
-
80
-
81
-
82
-
83
-
84
-
85
-
86
-
87
-
88
-
89
-
90
-
91
-
92
-
93
-
94
-
95
-
96
-
97
-
98
-
99
-
100
-
101
-
102
-
103
-
104
-
105
-
106
-
107
-
108
-
109
-
110
-
111
-
112
-
113
-
114
-
115
-
116
-
117
-
118
-
119
-
120
-
121
-
122
-
123
-
124
-
125
-
126
-
127
-
128
-
129
-
130
-
131
-
132
-
133
-
134
-
135
-
136
-
137
-
138
-
139
-
140
-
141
-
142
-
143
-
144
-
145
-
146
-
147
-
148
-
149
-
150
-
151
-
152
-
153
-
154
-
155
-
156
-
157
-
158
-
159
-
160
-
161
-
162
-
163
-
164
-
165
-
166
-
167
-
168
-
169
-
170
-
171
-
172
-
173
-
174
-
175
-
176
-
177
-
178
-
179
-
180
-
181
-
182
-
183
-
184
-
185
-
186
-
187
-
188
-
189
-
190
-
191
-
192
-
193
-
194
-
195
-
196
-
197
-
198
-
199
-
200
-
201
-
202
-
203
-
204
-
205
-
206
-
207
-
208
-
209
-
210
-
211
-
212
-
213
-
214
-
215
-
216
-
217
-
218
-
219
-
220
-
221
-
222
-
223
-
224
-
225
-
226
-
227
-
228
-
229
-
230
-
231
-
232
-
233
-
234
-
235
-
236
-
237
-
238
-
239
-
240
-
241
-
242
-
243
-
244
-
245
-
246
-
247
-
248
-
249
-
250
-
251
-
252
-
253
-
254
-
255
-
256
-
257
-
258
-
259
-
260
-
261
-
262
-
263
-
264
-
265
-
266
-
267
-
268
-
269
-
270
-
271
-
272
-
273
-
274
-
275
-
276
-
277
-
278
-
279
-
280
-
281
-
282
-
283
-
284
-
285
-
286
-
287
-
288
-
289
-
290
-
291
-
292
-
293
-
294
-
295
-
296
-
297
-
298
-
299
-
300
-
301
-
302
-
303
-
304
-
305
-
306
-
307
-
308
-
309
-
310
-
311
-
312
 |
 |

31
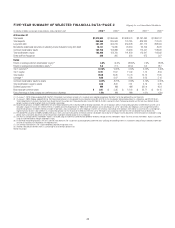
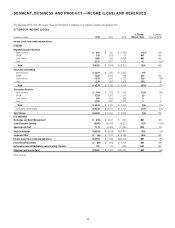
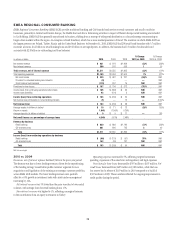
CITIGROUP REVENUES
In millions of dollars 2010 2009 2008
% Change
2010 vs. 2009
% Change
2009 vs. 2008
CITICORP
Regional Consumer Banking
North America $14,790 $ 8,576 $ 8,607 72% —%
EMEA 1,511 1,555 1,865 (3) (17)
Latin America 8,727 7,917 9,488 10 (17)
Asia 7,414 6,766 7,461 10 (9)
Total $32,442 $ 24,814 $ 27,421 31% (10)%
Securities and Banking
North America $ 9,392 $ 8,833 $ 10,821 6% (18)%
EMEA 6,842 10,049 5,963 (32) 69
Latin America 2,532 3,421 2,374 (26) 44
Asia 4,318 4,806 5,570 (10) (14)
Total $23,084 $ 27,109 $ 24,728 (15)% 10%
Transaction Services
North America $ 2,483 $ 2,526 $ 2,161 (2)% 17%
EMEA 3,356 3,389 3,677 (1) (8)
Latin America 1,490 1,373 1,439 9(5)
Asia 2,705 2,501 2,669 8(6)
Total $10,034 $ 9,789 $ 9,946 3% (2)%
Institutional Clients Group $33,118 $ 36,898 $ 34,674 (10)% 6%
Total Citicorp $65,560 $ 61,712 $ 62,095 6% (1)%
CITI HOLDINGS
Brokerage and Asset Management $ 609 $ 14,623 $ 7,963 (96)% 84%
Local Consumer Lending 15,826 17,765 23,498 (11) (24)
Special Asset Pool 2,852 (3,260) (39,699) NM 92
Total Citi Holdings $19,287 $ 29,128 $ (8,238) (34)% NM
Corporate/Other $ 1,754 $(10,555) $ (2,258) NM NM
Total net revenues $86,601 $ 80,285 $ 51,599 8% 56%
NM Not meaningful