Citibank 2010 Annual Report Download - page 276
Download and view the complete annual report
Please find page 276 of the 2010 Citibank annual report below. You can navigate through the pages in the report by either clicking on the pages listed below, or by using the keyword search tool below to find specific information within the annual report.-
 1
1 -
2
-
3
-
4
-
5
-
6
-
7
-
8
-
9
-
10
-
11
-
12
-
13
-
14
-
15
-
16
-
17
-
18
-
19
-
20
-
21
-
22
-
23
-
24
-
25
-
26
-
27
-
28
-
29
-
30
-
31
-
32
-
33
-
34
-
35
-
36
-
37
-
38
-
39
-
40
-
41
-
42
-
43
-
44
-
45
-
46
-
47
-
48
-
49
-
50
-
51
-
52
-
53
-
54
-
55
-
56
-
57
-
58
-
59
-
60
-
61
-
62
-
63
-
64
-
65
-
66
-
67
-
68
-
69
-
70
-
71
-
72
-
73
-
74
-
75
-
76
-
77
-
78
-
79
-
80
-
81
-
82
-
83
-
84
-
85
-
86
-
87
-
88
-
89
-
90
-
91
-
92
-
93
-
94
-
95
-
96
-
97
-
98
-
99
-
100
-
101
-
102
-
103
-
104
-
105
-
106
-
107
-
108
-
109
-
110
-
111
-
112
-
113
-
114
-
115
-
116
-
117
-
118
-
119
-
120
-
121
-
122
-
123
-
124
-
125
-
126
-
127
-
128
-
129
-
130
-
131
-
132
-
133
-
134
-
135
-
136
-
137
-
138
-
139
-
140
-
141
-
142
-
143
-
144
-
145
-
146
-
147
-
148
-
149
-
150
-
151
-
152
-
153
-
154
-
155
-
156
-
157
-
158
-
159
-
160
-
161
-
162
-
163
-
164
-
165
-
166
-
167
-
168
-
169
-
170
-
171
-
172
-
173
-
174
-
175
-
176
-
177
-
178
-
179
-
180
-
181
-
182
-
183
-
184
-
185
-
186
-
187
-
188
-
189
-
190
-
191
-
192
-
193
-
194
-
195
-
196
-
197
-
198
-
199
-
200
-
201
-
202
-
203
-
204
-
205
-
206
-
207
-
208
-
209
-
210
-
211
-
212
-
213
-
214
-
215
-
216
-
217
-
218
-
219
-
220
-
221
-
222
-
223
-
224
-
225
-
226
-
227
-
228
-
229
-
230
-
231
-
232
-
233
-
234
-
235
-
236
-
237
-
238
-
239
-
240
-
241
-
242
-
243
-
244
-
245
-
246
-
247
-
248
-
249
-
250
-
251
-
252
-
253
-
254
-
255
-
256
-
257
-
258
-
259
-
260
-
261
-
262
-
263
-
264
-
265
-
 266
266 -
 267
267 -
 268
268 -
 269
269 -
 270
270 -
 271
271 -
 272
272 -
 273
273 -
 274
274 -
 275
275 -
 276
276 -
 277
277 -
 278
278 -
 279
279 -
 280
280 -
 281
281 -
 282
282 -
 283
283 -
 284
284 -
 285
285 -
 286
286 -
287
-
288
-
289
-
290
-
291
-
292
-
293
-
294
-
295
-
296
-
297
-
298
-
299
-
300
-
301
-
302
-
303
-
304
-
305
-
306
-
307
-
308
-
309
-
310
-
311
-
312
 |
 |

274
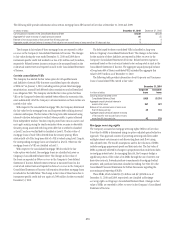
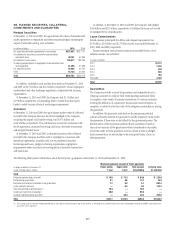
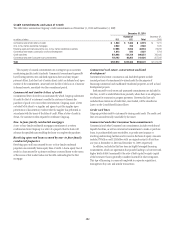
The following table provides information about certain mortgage loans HFS carried at fair value at December 31, 2010 and, 2009:
In millions of dollars December 31, 2010 December 31, 2009
Carrying amount reported on the Consolidated Balance Sheet $7,230 $3,338
Aggregate fair value in excess of unpaid principal balance 81 55
Balance of non-accrual loans or loans more than 90 days past due 14
Aggregate unpaid principal balance in excess of fair value for non-accrual loans or loans more than 90 days past due 13
The changes in fair values of these mortgage loans are reported in Other
revenue in the Company’s Consolidated Statement of Income. The changes
in fair value during the years ended December 31, 2010 and 2009 due to
instrument-specific credit risk resulted in a loss of $1 million and $4 million,
respectively. Related interest income continues to be measured based on the
contractual interest rates and reported as such in the Consolidated Statement
of Income.
Certain consolidated VIEs
The Company has elected the fair value option for all qualified assets
and liabilities of certain VIEs that were consolidated upon the adoption
of SFAS 167 on January 1, 2010, including certain private label mortgage
securitizations, mutual fund deferred sales commissions and collateralized
loan obligation VIEs. The Company elected the fair value option for these
VIEs as the Company believes this method better reflects the economic risks,
since substantially all of the Company’s retained interests in these entities are
carried at fair value.
With respect to the consolidated mortgage VIEs, the Company determined
the fair value for the mortgage loans and long-term debt utilizing internal
valuation techniques. The fair value of the long-term debt measured using
internal valuation techniques is verified, where possible, to prices obtained
from independent vendors. Vendors compile prices from various sources and
may apply matrix pricing for similar securities when no price is observable.
Security pricing associated with long-term debt that is verified is classified
as Level 2 and non-verified debt is classified as Level 3. The fair value of
mortgage loans of each VIE is derived from the security pricing. When
substantially all of the long-term debt of a VIE is valued using Level 2 inputs,
the corresponding mortgage loans are classified as Level 2. Otherwise, the
mortgage loans of a VIE are classified as Level 3.
With respect to the consolidated mortgage VIEs for which the fair
value option was elected, the mortgage loans are classified as Loans on
Citigroup’s Consolidated Balance Sheet. The changes in fair value of
the loans are reported as Other revenue in the Company’s Consolidated
Statement of Income. Related interest revenue is measured based on the
contractual interest rates and reported as Interest revenue in the Company’s
Consolidated Statement of Income. Information about these mortgage loans
is included in the table below. The change in fair value of these loans due to
instrument-specific credit risk was a gain of $190 million for the year ended
December 31, 2010.
The debt issued by these consolidated VIEs is classified as long-term
debt on Citigroup’s Consolidated Balance Sheet. The changes in fair value
for the majority of these liabilities are reported in Other revenue in the
Company’s Consolidated Statement of Income. Related interest expense is
measured based on the contractual interest rates and reported as such in the
Consolidated Statement of Income. The aggregate unpaid principal balance
of long-term debt of these consolidated VIEs exceeded the aggregate fair
value by $857 million as of December 31, 2010.
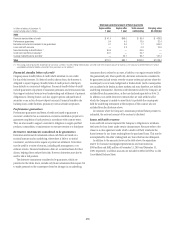
The following table provides information about Corporate and Consumer
loans of consolidated VIEs carried at fair value:
December 31, 2010
In millions of dollars
Corporate
loans
Consumer
loans
Carrying amount reported on the
Consolidated Balance Sheet $425 $1,718
Aggregate unpaid principal balance in
excess of fair value 357 527
Balance of non-accrual loans or loans more
than 90 days past due 45 133
Aggregate unpaid principal balance in excess
of fair value for non-accrual loans or loans
more than 90 days past due 43 139
Mortgage servicing rights
The Company accounts for mortgage servicing rights (MSRs) at fair value.
Fair value for MSRs is determined using an option-adjusted spread valuation
approach. This approach consists of projecting servicing cash flows under
multiple interest-rate scenarios and discounting these cash flows using
risk-adjusted rates. The model assumptions used in the valuation of MSRs
include mortgage prepayment speeds and discount rates. The fair value of
MSRs is primarily affected by changes in prepayments that result from shifts
in mortgage interest rates. In managing this risk, the Company hedges a
significant portion of the values of its MSRs through the use of interest-rate
derivative contracts, forward-purchase commitments of mortgage-backed
securities, and purchased securities classified as trading. See Note 22 to the
Consolidated Financial Statements for further discussions regarding the
accounting and reporting of MSRs.
These MSRs, which totaled $4.554 billion and $6.530 billion as of
December 31, 2010 and 2009, respectively, are classified as Mortgage
servicing rights on Citigroup’s Consolidated Balance Sheet. Changes in fair
value of MSRs are recorded in Other revenue in the Company’s Consolidated
Statement of Income.