Citibank 2010 Annual Report Download - page 264
Download and view the complete annual report
Please find page 264 of the 2010 Citibank annual report below. You can navigate through the pages in the report by either clicking on the pages listed below, or by using the keyword search tool below to find specific information within the annual report.-
 1
1 -
2
-
3
-
4
-
5
-
6
-
7
-
8
-
9
-
10
-
11
-
12
-
13
-
14
-
15
-
16
-
17
-
18
-
19
-
20
-
21
-
22
-
23
-
24
-
25
-
26
-
27
-
28
-
29
-
30
-
31
-
32
-
33
-
34
-
35
-
36
-
37
-
38
-
39
-
40
-
41
-
42
-
43
-
44
-
45
-
46
-
47
-
48
-
49
-
50
-
51
-
52
-
53
-
54
-
55
-
56
-
57
-
58
-
59
-
60
-
61
-
62
-
63
-
64
-
65
-
66
-
67
-
68
-
69
-
70
-
71
-
72
-
73
-
74
-
75
-
76
-
77
-
78
-
79
-
80
-
81
-
82
-
83
-
84
-
85
-
86
-
87
-
88
-
89
-
90
-
91
-
92
-
93
-
94
-
95
-
96
-
97
-
98
-
99
-
100
-
101
-
102
-
103
-
104
-
105
-
106
-
107
-
108
-
109
-
110
-
111
-
112
-
113
-
114
-
115
-
116
-
117
-
118
-
119
-
120
-
121
-
122
-
123
-
124
-
125
-
126
-
127
-
128
-
129
-
130
-
131
-
132
-
133
-
134
-
135
-
136
-
137
-
138
-
139
-
140
-
141
-
142
-
143
-
144
-
145
-
146
-
147
-
148
-
149
-
150
-
151
-
152
-
153
-
154
-
155
-
156
-
157
-
158
-
159
-
160
-
161
-
162
-
163
-
164
-
165
-
166
-
167
-
168
-
169
-
170
-
171
-
172
-
173
-
174
-
175
-
176
-
177
-
178
-
179
-
180
-
181
-
182
-
183
-
184
-
185
-
186
-
187
-
188
-
189
-
190
-
191
-
192
-
193
-
194
-
195
-
196
-
197
-
198
-
199
-
200
-
201
-
202
-
203
-
204
-
205
-
206
-
207
-
208
-
209
-
210
-
211
-
212
-
213
-
214
-
215
-
216
-
217
-
218
-
219
-
220
-
221
-
222
-
223
-
224
-
225
-
226
-
227
-
228
-
229
-
230
-
231
-
232
-
233
-
234
-
235
-
236
-
237
-
238
-
239
-
240
-
241
-
242
-
243
-
244
-
245
-
246
-
247
-
248
-
249
-
250
-
251
-
252
-
253
-
 254
254 -
 255
255 -
 256
256 -
 257
257 -
 258
258 -
 259
259 -
 260
260 -
 261
261 -
 262
262 -
 263
263 -
 264
264 -
 265
265 -
 266
266 -
 267
267 -
 268
268 -
 269
269 -
 270
270 -
 271
271 -
 272
272 -
 273
273 -
 274
274 -
275
-
276
-
277
-
278
-
279
-
280
-
281
-
282
-
283
-
284
-
285
-
286
-
287
-
288
-
289
-
290
-
291
-
292
-
293
-
294
-
295
-
296
-
297
-
298
-
299
-
300
-
301
-
302
-
303
-
304
-
305
-
306
-
307
-
308
-
309
-
310
-
311
-
312
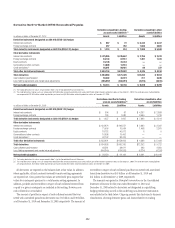
 |
 |
262
Bilateral or “own” credit-risk adjustments are applied to reflect the
Company’s own credit risk when valuing derivatives and liabilities measured
at fair value. Counterparty and own credit adjustments consider the expected
future cash flows between Citi and its counterparties under the terms of
the instrument and the effect of credit risk on the valuation of those cash
flows, rather than a point-in-time assessment of the current recognized net
asset or liability. Furthermore, the credit-risk adjustments take into account
the effect of credit-risk mitigants, such as pledged collateral and any legal
right of offset (to the extent such offset exists) with a counterparty through
arrangements such as netting agreements.
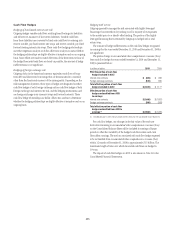
Auction rate securities
Auction rate securities (ARS) are long-term municipal bonds, corporate
bonds, securitizations and preferred stocks with interest rates or dividend
yields that are reset through periodic auctions. The coupon paid in the
current period is based on the rate determined by the prior auction. In the
event of an auction failure, ARS holders receive a “fail rate” coupon, which is
specified in the original issue documentation of each ARS.
Where insufficient orders to purchase all of the ARS issue to be sold
in an auction were received, the primary dealer or auction agent would
traditionally have purchased any residual unsold inventory (without a
contractual obligation to do so). This residual inventory would then be
repaid through subsequent auctions, typically in a short time. Due to this
auction mechanism and generally liquid market, ARS have historically
traded and were valued as short-term instruments.
Citigroup acted in the capacity of primary dealer for approximately
$72 billion of ARS and continued to purchase residual unsold inventory
in support of the auction mechanism until mid-February 2008. After this
date, liquidity in the ARS market deteriorated significantly, auctions failed
due to a lack of bids from third-party investors, and Citigroup ceased to
purchase unsold inventory. Following a number of ARS refinancings, at
December 31, 2010, Citigroup continued to act in the capacity of primary
dealer for approximately $23 billion of outstanding ARS.
The Company classifies its ARS as held-to-maturity, available-for-sale and
trading securities.
Prior to the Company’s first auction’s failing in the first quarter of 2008,
Citigroup valued ARS based on observation of auction market prices, because
the auctions had a short maturity period (7, 28 and 35 days). This generally
resulted in valuations at par. Once the auctions failed, ARS could no longer
be valued using observation of auction market prices. Accordingly, the fair
values of ARS are currently estimated using internally developed discounted
cash flow valuation techniques specific to the nature of the assets underlying
each ARS.
For ARS with U.S. municipal securities as underlying assets, future cash
flows are estimated based on the terms of the securities underlying each
individual ARS and discounted at an estimated discount rate in order to
estimate the current fair value. The key assumptions that impact the ARS
valuations are estimated prepayments and refinancings, estimated fail rate
coupons (i.e., the rate paid in the event of auction failure, which varies
according to the current credit rating of the issuer) and the discount rate
used to calculate the present value of projected cash flows. The discount
rate used for each ARS is based on rates observed for straight issuances of
other municipal securities. In order to arrive at the appropriate discount
rate, these observed rates were adjusted upward to factor in the specifics of
the ARS structure being valued, such as callability, and the illiquidity in the
ARS market.
For ARS with student loans as underlying assets, future cash flows are
estimated based on the terms of the loans underlying each individual ARS,
discounted at an appropriate rate in order to estimate the current fair value.
The key assumptions that impact the ARS valuations are the expected
weighted average life of the structure, estimated fail rate coupons, the
amount of leverage in each structure and the discount rate used to calculate
the present value of projected cash flows. The discount rate used for each ARS
is based on rates observed for basic securitizations with similar maturities
to the loans underlying each ARS being valued. In order to arrive at the
appropriate discount rate, these observed rates were adjusted upward to factor
in the specifics of the ARS structure being valued, such as callability, and the
illiquidity in the ARS market.
During the first quarter of 2008, ARS for which the auctions failed and
where no secondary market has developed were moved to Level 3, as the
assets were subject to valuation using significant unobservable inputs. The
majority of ARS continue to be classified as Level 3.
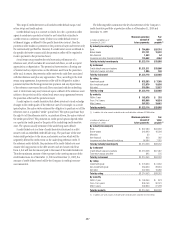
Alt-A mortgage securities
The Company classifies its Alt-A mortgage securities as held-to-maturity,
available-for-sale and trading investments. The securities classified as
trading and available-for-sale are recorded at fair value with changes in
fair value reported in current earnings and AOCI, respectively. For these
purposes, Citi defines Alt-A mortgage securities as non-agency residential
mortgage-backed securities (RMBS) where (1) the underlying collateral has
weighted average FICO scores between 680 and 720 or (2) for instances where
FICO scores are greater than 720, RMBS have 30% or less of the underlying
collateral composed of full documentation loans.
Similar to the valuation methodologies used for other trading securities
and trading loans, the Company generally determines the fair values of
Alt-A mortgage securities utilizing internal valuation techniques. Fair-value
estimates from internal valuation techniques are verified, where possible,
to prices obtained from independent vendors. Vendors compile prices from
various sources. Where available, the Company may also make use of
quoted prices for recent trading activity in securities with the same or similar
characteristics to the security being valued.